3:30 p.m. New York time
Half an hour before the closing bell. The S&P 500 climbed higher early in the session, peaking at 4260.50 on the futures. It then began to decline, reaching below 4210 as the closing bell approached. No change in the analysis. I’ve updated the chart.
9:35 a.m. New York time
What’s happening now? The S&P 500 E-mini futures continued to rise overnight, reaching a high of 4247 before the opening bell.
What does it mean? The rise from July 14, from 3723.75, is now in the middle wave of a five-wave uptrend. Internally, it is also in its middle wave, which has reached its end game, in its 5th and final subwave.
What are the alternatives? As has been the case the past few days, each peak could be the end of the uptrend, or not. We’ll know the uptrend is complete when it reverses into a significant decline.
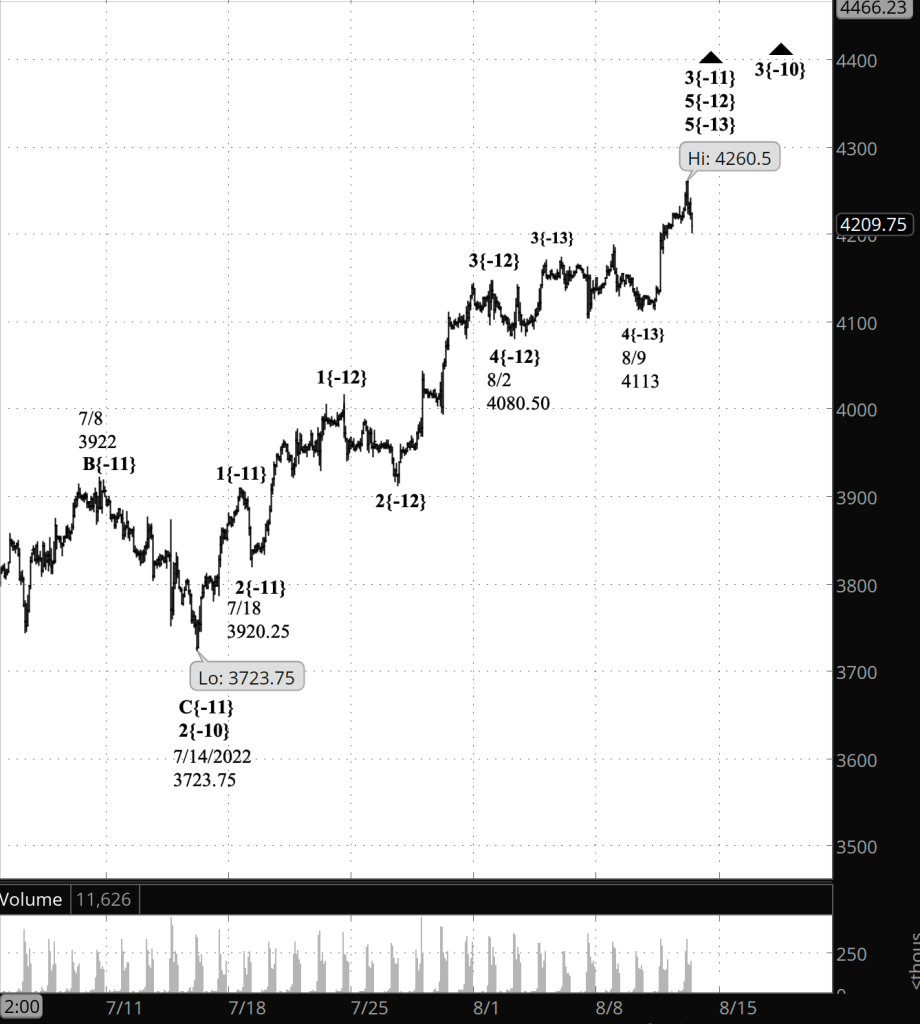
What does Elliott wave theory say? The uptrend that began on July 14 is wave 3{-10}, the middle wave within wave 1{-9}, which began on June 17 from 4202.25. Working from larger to smaller degrees, here is an inventory of the present wave line-up: Wave 3{-11} began on July 18 from 3920.25; within it, wave 5{-12} began on August 2 from 4080.25; and, still smaller, wave 5{-13} began on August 9 from 4113.
The end of wave 5{-13} will also be the end of waves 5{-12} and 3{-11}. A downward correction, wave 4{-11} will follow, to be followed in turn by a push to higher highs with wave 5{-11}. The end of wave 5{-11} will also be the end of wave 3{-10}, which will begin a 4th wave downward correction.
It is important to remember that all these uptrends and corrections of small degree are happening within huge downtrend, wave 4{-1}, that began on January 4 from 4808.25. It has a long way to go before reaching its end, perhaps down into the 2000s or lower. It will be followed by an uptrend that likely will carry the price above the January 4 high, perhaps into the 4900s or higher.
A note on trades. The earnings season is winding down and so I’m finding fewer options trades that fit my strategy, which is based on earnings announcements. The next earnings season will begin in October, and in the meantime there will be an occasional opportunity worth exploring.
Learning and other resources. Elliott wave analysis provides context, not prophecy. As the 20th century semanticist Alfred Korzybski put it in his book Science and Sanity (1933), “The map is not the territory … The only usefulness of a map depends on similarity of structure between the empirical world and the map.” And I would add, in the ever-changing markets, we can judge that similarity of structure only after the fact.
See the menu page Analytical Methods for a rundown on where to go for information on Elliott wave analysis.
By Tim Bovee, Portland, Oregon, August 11, 2022
Disclaimer
Tim Bovee, Private Trader tracks the analysis and trades of a private trader for his own accounts. Nothing in this blog constitutes a recommendation to buy or sell stocks, options or any other financial instrument. The only purpose of this blog is to provide education and entertainment.
No trader is ever 100 percent successful in his or her trades. Trading in the stock and option markets is risky and uncertain. Each trader must make trading decisions for his or her own account, and take responsibility for the consequences.
License
All content on Tim Bovee, Private Trader by Timothy K. Bovee is licensed under a Creative Commons Attribution-ShareAlike 4.0 International License.
Based on a work at www.timbovee.com.

You must be logged in to post a comment.