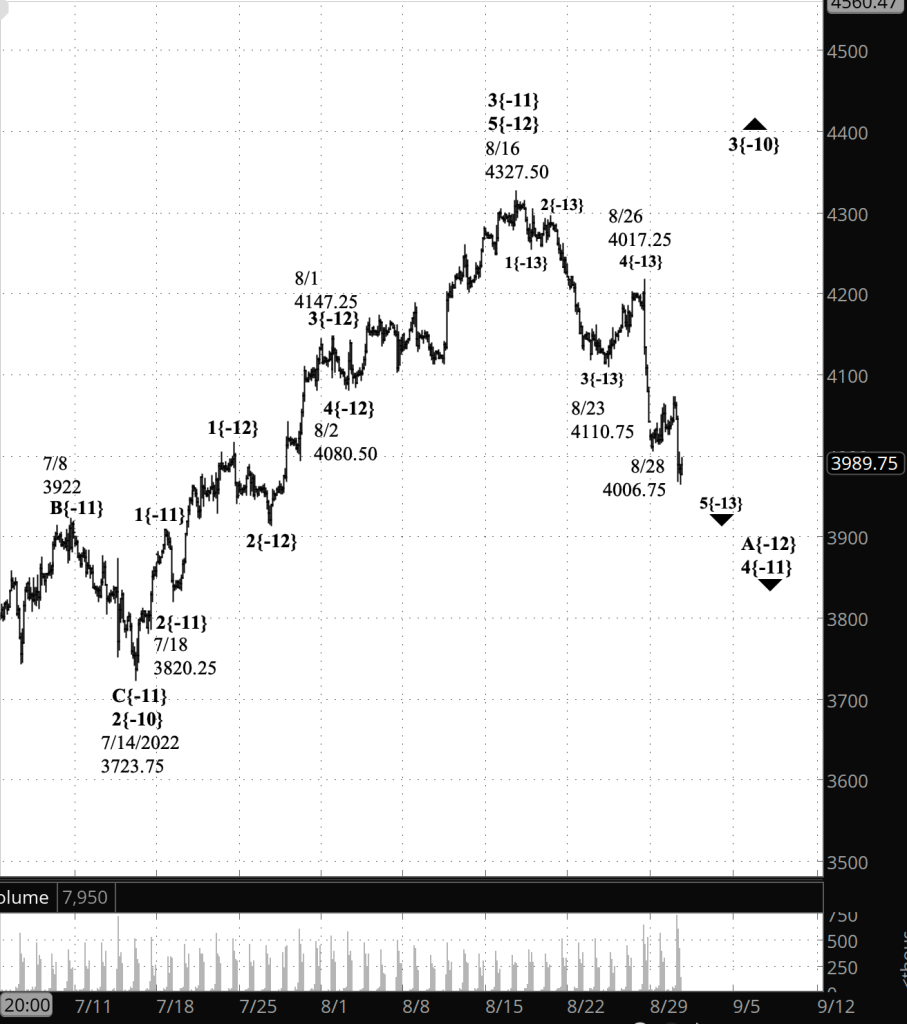
3:30 p.m. New York time
Half an hour before the closing bell. The rise overnight proved to be a bump within the sharp decline that began on August 26. In today’s session the price reached a low of 3964.50 on the futures. The first leg of the downward correction that began on August 16 — wave A{-12} within wave 4{-11} — is still underway. That first leg is in turn in its last segment, wave 5{-13}. I’ve added an afternoon the chart, retaining this morning’s chart for comparison
9:35 a.m. New York time
What’s happening now? The S&P 500 E-mini futures rose overnight, returning to the 4070s after reaching a low on August 28 of 4006.75.
What does it mean? The rising second leg of a downward correction that began on August 16 is now underway. The correction is taking a Zigzag pattern, and so the price will remain below the start of the correction, 4327.50.
What is the alternative? The entire rise from July 14 to August 16, which I’ve labeled as the middle wave of an uptrend, may in fact be the final wave. If so, then the decline that followed is a downtrend rather than being part of a downward correction.
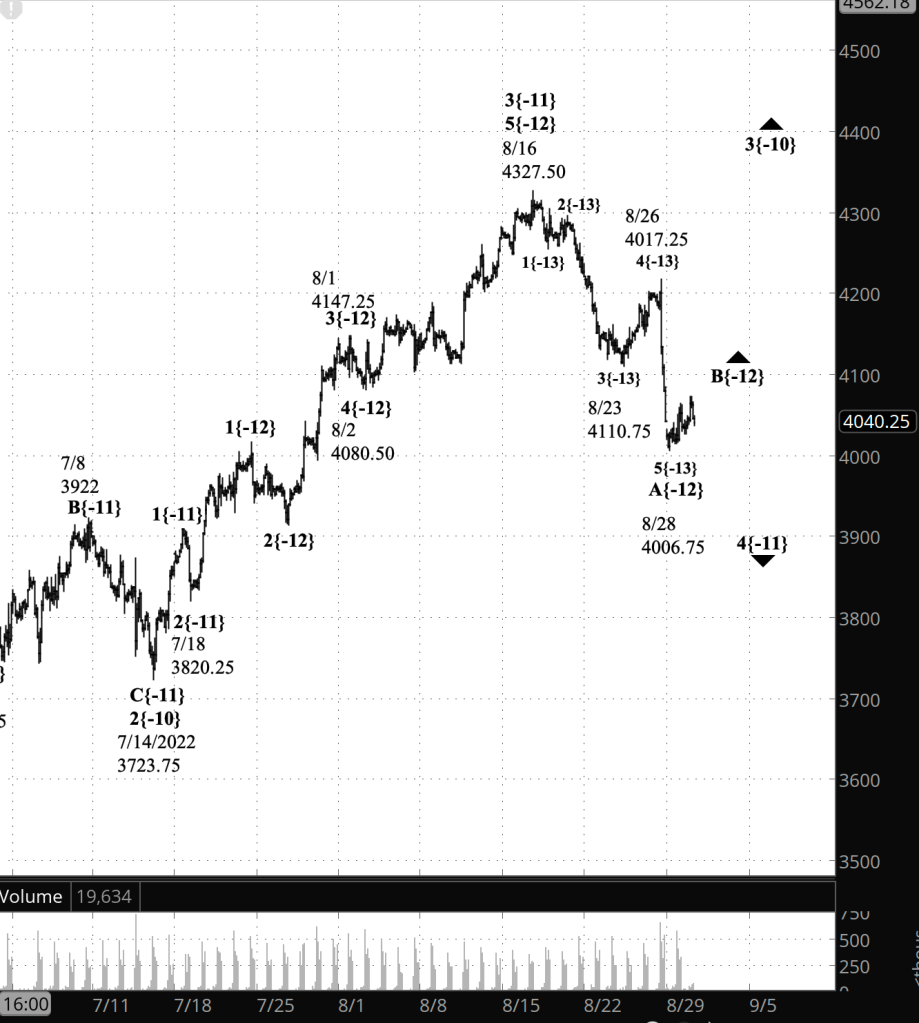
What does Elliott wave theory say? Under the principal analysis, the rise from August 28 is wave B{-12} within wave 4{-11}, the downward correction that began on August 16 from 4327.50, the peak of wave 3{-11}. The first leg of correction, wave A{-12}, has five waves internally, so the correction is most likely taking the form of a Zigzag. The B wave of a Zigzag typically retraces 38% to 79% of the preceding A wave, giving a rather broad target range of 4129 to 4260, more or less. The overnight high was 4072.75.
Under the alternative analysis, the August 16 peak marked the end of wave 5{-11}, and the decline that followed is the early stage of wave 4{-10}, whose preceding 3rd wave began on July 14.
Learning and other resources. Elliott wave analysis provides context, not prophecy. As the 20th century semanticist Alfred Korzybski put it in his book Science and Sanity (1933), “The map is not the territory … The only usefulness of a map depends on similarity of structure between the empirical world and the map.” And I would add, in the ever-changing markets, we can judge that similarity of structure only after the fact.
See the menu page Analytical Methods for a rundown on where to go for information on Elliott wave analysis.
By Tim Bovee, Portland, Oregon, August 30, 2022
Disclaimer
Tim Bovee, Private Trader tracks the analysis and trades of a private trader for his own accounts. Nothing in this blog constitutes a recommendation to buy or sell stocks, options or any other financial instrument. The only purpose of this blog is to provide education and entertainment.
No trader is ever 100 percent successful in his or her trades. Trading in the stock and option markets is risky and uncertain. Each trader must make trading decisions for his or her own account, and take responsibility for the consequences.
License
All content on Tim Bovee, Private Trader by Timothy K. Bovee is licensed under a Creative Commons Attribution-ShareAlike 4.0 International License.
Based on a work at www.timbovee.com.

You must be logged in to post a comment.