3:30 p.m. New York time
Half an hour before the closing bell. The S&P 500 continued to fall during the session, reaching beyond the overnight low down to 3956.50 on the futures. No change in the analysis. Downward wave 5{-13} with wave A{-12} within 4{-11} is still underway. I’ve updated the chart.
1 p.m. New York time
NTNX earnings play entry. I’ve entered a short bull put vertical spread on NTNX, using options that trade for the last time on October 21, and have posted an analysis of the trade.
9:35 a.m. New York time
What’s happening now? The S&P 500 E-mini futures reached a low overnight of 3979.25 and then bounced slightly.
What does it mean? The sharp price drop that began on August 26 continues, although at a more moderate pace.
What are the alternatives? There are two.
Alternative #1: The overnight low was the end of the price drop and an uptrend is underway.
Alternative #2: The uptrend that began on June 14 ended on August 16 and a larger downward movement is underway.
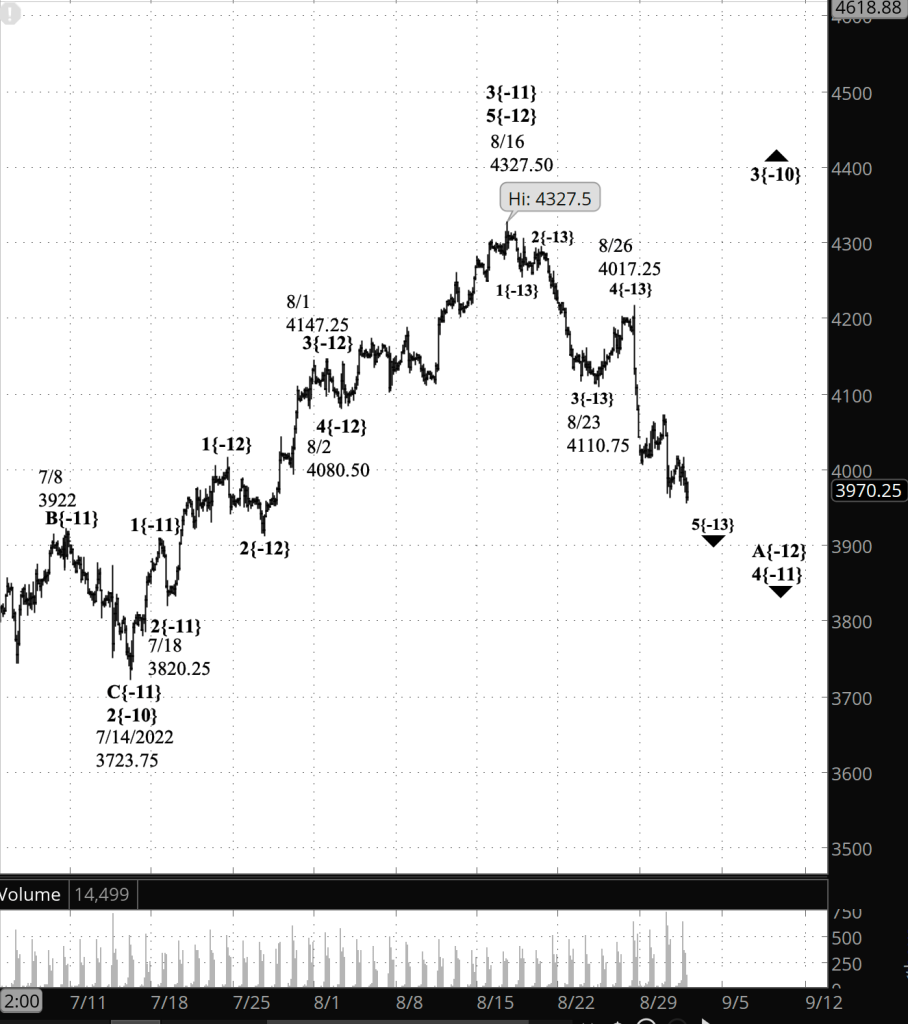
What does Elliott wave theory say? Under the principal analysis, downward wave 5{-13} within wave A{-12} within wave 4{-11}, a downward correction, is underway. It will be followed by a B wave to the upside, and then a continuation of the correction with a C wave to the downside.
Under the first alternative analysis, the overnight low marked the end of wave 4{-11}, and uptrending wave 5{-11} is now underway and will reach into the 4300s.
Under the second alternative, the August 16 peak was the end of wave 5{-11} and its parent, wave 3{-10}, which began on July 14. This scenario sees a downward correction, wave 4{-10}, as being underway.
Learning and other resources. Elliott wave analysis provides context, not prophecy. As the 20th century semanticist Alfred Korzybski put it in his book Science and Sanity (1933), “The map is not the territory … The only usefulness of a map depends on similarity of structure between the empirical world and the map.” And I would add, in the ever-changing markets, we can judge that similarity of structure only after the fact.
See the menu page Analytical Methods for a rundown on where to go for information on Elliott wave analysis.
By Tim Bovee, Portland, Oregon, August 31, 2022
Disclaimer
Tim Bovee, Private Trader tracks the analysis and trades of a private trader for his own accounts. Nothing in this blog constitutes a recommendation to buy or sell stocks, options or any other financial instrument. The only purpose of this blog is to provide education and entertainment.
No trader is ever 100 percent successful in his or her trades. Trading in the stock and option markets is risky and uncertain. Each trader must make trading decisions for his or her own account, and take responsibility for the consequences.
License
All content on Tim Bovee, Private Trader by Timothy K. Bovee is licensed under a Creative Commons Attribution-ShareAlike 4.0 International License.
Based on a work at www.timbovee.com.

You must be logged in to post a comment.