3:30 p.m. New York time
Half an hour before the closing bell. The S&P 500 has traded in a narrow range during the session, swinging between the 3970s and the 3920s on the futures. Any new low could mean that the upward correction, wave 4{-11}, has ended, and downtrending wave 5{-11} is underway. Meanwhile, no change in the analysis. I’ve updated the upper, close-up chart.
9:35 a.m. New York time
What’s happening now? The S&P 500 E-mini futures reached into the 3930s yesterday and then switched to a shallow rise that so far has returned the price to the 3970s.
What does it mean? The downtrend that began on September 13 continues. It is now in its middle segment, which internally is in an upward correction that will be followed by a further decline. That larger middle segment, in turn, will be followed by a larger upward correction, and then an even deeper decline.
The further the price declines, the more likely this scenario becomes. The key price level is the September 6 low, 3883.50, the starting point of the upward correction. A drop below that level gives this principal analysis greater credibility.
What is the alternative? It’s possible that the decline that began on September 13 is the middle leg of an ongoing upward correction that began on September 6. If that proves to be the case, then there will be a return to a rising price soon that will likely exceed the September 13 high, 4175. A reversal above the September 6 low, 3883.50, gives this alternative analysis greater credibility.
The charts. The upper chart, showing the S&P 500 E-mini futures, focuses is on the decline that began on September 13 and the upward correction that preceded it, showing the internal count. The lower chart, showing the S&P 500 index, puts the price rise from October 30, 2020, the end of the early pandemic crash, into a larger context.
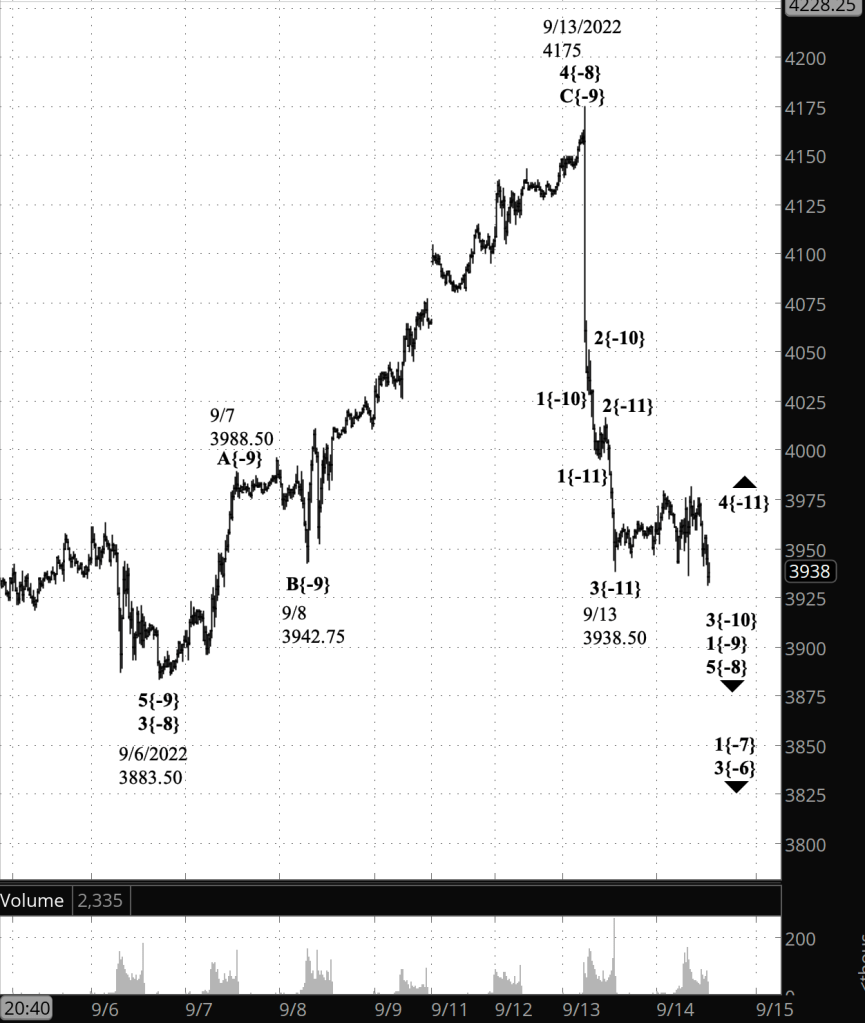

What does Elliott wave theory say? Under the principal analysis, the September 13 peak, 4175, was the end of wave 4{-8}, an upward correction, and the beginning of wave 5{-8}, a downtrend, the final wave within wave 1{-7}, which began on August 16. Wave 4{-8} began on September 6 from 3883.50, and that’s a key level in judging the nature of the decline since September 13. The further the price falls bellow 3883.50, the more likely the principal scenario becomes. Under this scenario, wave 5{-8} internally is in wave 1{-9}, which in turn is in wave 3{-10}, and which in turn is within wave 4{-11}, its next-to-the-last wave.
Under the alternative analysis, the September 13 peak was the end of wave A{-9}, the first subwave within wave 4{-8}, and the subsequent decline, now underway, is wave B{-9}. A reversal above 3883.50 and a clear rise toward the September 13 peak makes this alternative scenario more likely. Internally, wave B{-9} appears to be in its middle wave, B{-10}.
This is all happening within two waves that began on August 16, the child wave 1{-7} and the parent wave 3{-6}. They in turn are within wave 1{-4}, which began on January 4 — the end of the rise wave wave 3{-1}, which followed the early pandemic crash of 2020. The crash, the subsequent rise, and the present decline since January 4 are part of wave 5{0}, an expanding Diagonal Triangle that began on December 26, 2018 and that is the final wave with wave 5{+1}, which began on March 6, 2009 at the amazingly low price of 666.79 on the S&P 500 index. The top channel line of the wave 5{0} can be seen in red on the lower chart.
These charts ultimately have a lot of downside ahead. But the enclosing wave 5{0}, the Diagonal Triangle, is an uptrending wave, as is its parent and grandparent waves, from wave 5{+1}, which began in 2009, to wave 5{+3}, which began in 1932, during the Great Depression.
What’s the end game? The end of the Diagonal Triangle, wave 5{0}, will also be the end of the larger waves, up to 5{+3}. Afterward comes a correction that takes back a large portion of the entire rise since 1932.
So, bottom line: A rough few years ahead, followed by an impressive recovery and then some distance down the road, a decline of a magnitude that has not been seen for a almost century.
We Are Here.
These are the waves currently in progress under my principal analysis. Each line on the list shows the wave number, with the subscript in curly brackets, the traditional degree name, the starting date, the starting price of the S&P 500 E-mini futures, and the direction of the wave.
- S&P 500 Index:
- 5{+3} Supercycle, 7/8/1932, 4.40 (up)
- 5{+2} Cycle, 12/9/1974, 60.96 (up)
- 5{+1} Primary, 3/6/2009, 666.79 (up)
- 5{0} Intermediate, 12/26/2018, 2346.58 (up)
- 4{-1} Minor, 1/4/2022 4818.62 (down)
- 1{-2} Minute, 1/4/2022 4818.62 (down)
- S&P 500 Futures and index:
- 1{-3} Minuette, 1/4/2022, 4808.25 (down) (futures), 4818.62 (down) (index)
- S&P 500 Futures:
- 1{-4} Subminuette, 1/4/2022, 4808.25 (down)
- 1{-5} Micro, 1/4/2022, 4808.25 (down)
- 3{-6} Submicro, 8/16/2022, 4325.28 (down)
- 1{-7} Minuscule, 8/16/2022, 4325.28 (down)
- 5{-8} Subminuscule, 9/13/2022, 4175 (down)
Learning and other resources. Elliott wave analysis provides context, not prophecy. As the 20th century semanticist Alfred Korzybski put it in his book Science and Sanity (1933), “The map is not the territory … The only usefulness of a map depends on similarity of structure between the empirical world and the map.” And I would add, in the ever-changing markets, we can judge that similarity of structure only after the fact.
See the menu page Analytical Methods for a rundown on where to go for information on Elliott wave analysis.
By Tim Bovee, Portland, Oregon, September 14, 2022
Disclaimer
Tim Bovee, Private Trader tracks the analysis and trades of a private trader for his own accounts. Nothing in this blog constitutes a recommendation to buy or sell stocks, options or any other financial instrument. The only purpose of this blog is to provide education and entertainment.
No trader is ever 100 percent successful in his or her trades. Trading in the stock and option markets is risky and uncertain. Each trader must make trading decisions for his or her own account, and take responsibility for the consequences.
License
All content on Tim Bovee, Private Trader by Timothy K. Bovee is licensed under a Creative Commons Attribution-ShareAlike 4.0 International License.
Based on a work at www.timbovee.com.

You must be logged in to post a comment.