3:30 p.m. New York time
Half an hour before the closing bell. The S&P 500 continued to decline, reaching into the 3950s on the futures as the end of the session approached.
The analysis from this morning stands, as modified by the correction in the degree labeling that I made at midday. Internally, wave 1{-9} within with 5{-8} has had a single, small reversal to the upside. Which could mean the end of wave 1 and beginning of the 2nd wave of the five-wave structure. But the smallness of the reversal seems disproportionate to me, and I’m reluctant to adopt that count.
I do see an interesting prospect ahead. A firm rule of Elliott wave analysis is that the 3rd wave of a trend can’t be shorter than both waves 1 and 5. This is a fairly long 1st wave already, and usually the 1st wave is the shortest of them all. So that means that we can look forward to a really long 3rd wave — to the downside — or a 5th wave that’s unusually short, in order to be shorter than the 3rd wave. Wave 1{-9} so far is more than 200 points in length.
I’ve updated the chart.
12:40 p.m. New York time
Chart labeling correction. I’ve updated the chart to correct the labeling of the subwaves of wave 4{-8}, changing the degree from {-10} to {-9}. The futures have continued to fall during the session, so far reaching a low of 3995.75.
9:35 a.m. New York time
What’s happening now? The S&P 500 E-mini futures dropped overnight by 100 points in a single minute after inflation rose by 0.1% in August, to 8.3%. The price then continued to fall, at a slightly slower pace, with the entire decline covering from 4175 down to 4030.5.
What does it mean? The overnight high marked the end of an upward correction that began on September 6 and the start of a resumption of the downtrend that began on August 16. The decline is part of the final segment of that downtrend.
What is the alternative? The overnight high can also be counted as the end of the 1st wave of an ongoing upward correction, with the peak being the end of the initial segment within the correction, and the subsequent decline the beginning of the middle segment.
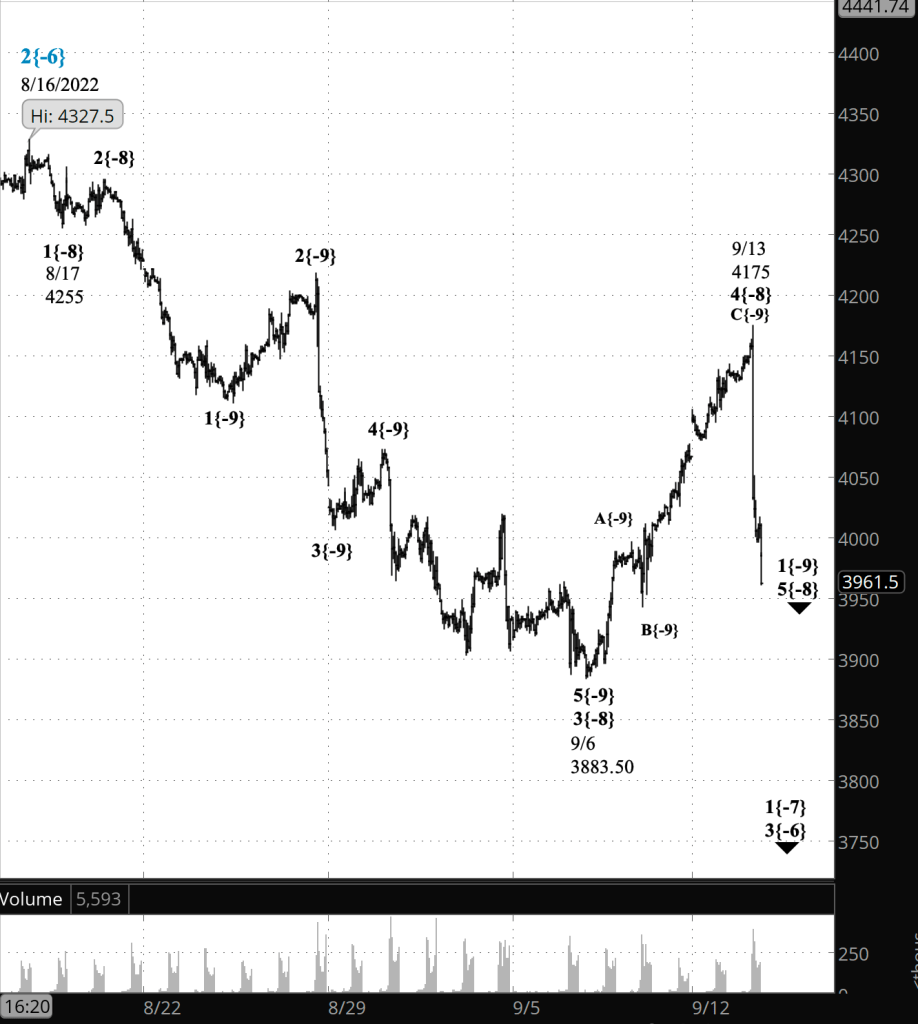
What does Elliott wave theory say? The overnight peak is the end of wave 4{-8}, an upward correction that began on September 6, and the beginning of wave 5{-8}, the final wave within wave 1{-7}, a downtrend that began on August 16 from 4327.50.
Under the alternative analysis, the overnight peak is the end of wave A{-9}, the first wave within the upward correction, wave 4{-8}. The subsequent decline is downward wave B{-9}, the middle wave of the correction, and it will be followed by upward wave C{-9}, the final wave within wave 4{-8}, which may carry the price above the overnight high.
I chose the wave 5{-8} scenario because of the power of the decline. Trending waves — especially the 3rd but also the 5th — tend to be powerful. Corrective waves tend to be more tentative. But there are powerful B waves, and so those tendencies don’t make the alternative analysis implausible.
When wave 1{-7} is complete, it will be followed by wave 2{-7}, another upward correction a degree larger than the one that was just completed.
This is all happening within downtrending wave 3{-6}, which also began on August 16.
We Are Here.
These are the waves currently in progress under my principal analysis. Each line on the list shows the wave number, with the subscript in curly brackets, the traditional degree name, the starting date, the starting price of the S&P 500 E-mini futures, and the direction of the wave.
- S&P 500 Index:
- 5{+3} Supercycle, 7/8/1932, 4.40 (up)
- 5{+2} Cycle, 12/9/1974, 60.96 (up)
- 5{+1} Primary, 3/6/2009, 666.79 (up)
- 5{0} Intermediate, 12/26/2018, 2346.58 (up)
- 4{-1} Minor, 1/4/2022 4818.62 (down)
- 1{-2} Minute, 1/4/2022 4818.62 (down)
- S&P 500 Futures and index:
- 1{-3} Minuette, 1/4/2022, 4808.25 (down) (futures), 4818.62 (down) (index)
- S&P 500 Futures:
- 1{-4} Subminuette, 1/4/2022, 4808.25 (down)
- 1{-5} Micro, 1/4/2022, 4808.25 (down)
- 3{-6} Submicro, 8/16/2022, 4325.28 (down)
- 1{-7} Minuscule, 8/16/2022, 4325.28 (down)
- 5{-8} Subminuscule, 9/13/2022, 4175 (down)
Learning and other resources. Elliott wave analysis provides context, not prophecy. As the 20th century semanticist Alfred Korzybski put it in his book Science and Sanity (1933), “The map is not the territory … The only usefulness of a map depends on similarity of structure between the empirical world and the map.” And I would add, in the ever-changing markets, we can judge that similarity of structure only after the fact.
See the menu page Analytical Methods for a rundown on where to go for information on Elliott wave analysis.
By Tim Bovee, Portland, Oregon, September 13, 2022
Disclaimer
Tim Bovee, Private Trader tracks the analysis and trades of a private trader for his own accounts. Nothing in this blog constitutes a recommendation to buy or sell stocks, options or any other financial instrument. The only purpose of this blog is to provide education and entertainment.
No trader is ever 100 percent successful in his or her trades. Trading in the stock and option markets is risky and uncertain. Each trader must make trading decisions for his or her own account, and take responsibility for the consequences.
License
All content on Tim Bovee, Private Trader by Timothy K. Bovee is licensed under a Creative Commons Attribution-ShareAlike 4.0 International License.
Based on a work at www.timbovee.com.

You must be logged in to post a comment.