3:31 p.m. New York time
Half an hour before the closing bell. The S&P 500 rose to 39-teens on the futures and then fell again. The movement means that the upward correction that began on September 16 from 3853 has further to go. In Elliott wave terminology, wave upward wave 4{-12} within wave downtrending wave 5{-11} is underway and is nearing its end. Any fresh high could be the end of the correction, or not. I’ve updated the chart.
9:35 a.m. New York time
What’s happening now? The S&P 500 E-mini futures resumed their fall after trading resumed overnight, reaching into the 3840s.
What does it mean? The downtrend that began on September 13 from 4051.25 continues and is in its middle leg. It will be followed by an upward correction that can be expected to take back a portion — perhaps a significant amount — of the decline. Or, the decline could be quite shallow, depending upon the form the correction takes. Corrective movements have a lot of variety.
What is the alternative? The main ambiguity is where the price stands within that middle leg of the downtrend. The principal analysis has it as two levels smaller. It could be three. More on this in the Elliott wave theory section below. There are similar ambiguities at larger levels.
The charts. The upper chart gives a close-up view of the S&P 500 futures from September 6 to the present. The lower chart gives a long-term view of the S&P 500 index from February 19, 2020 to the present.

What does Elliott wave theory say? The downtrend that began on September 13, wave 3{-10}, is now its its middle subwave, 3{-11}, under the principal analysis. Under an alternative analysis, that 3rd wave is a degree smaller, wave 3{-12}. Under both scenarios, the 3rd wave that began on September 13 is in its 5th wave internally, wave 5{-12} under the principal analysis and wave 5{-13} under the alternative.
The conundrum illustrates the difficulty in judging the precise degree of subwaves. The only guides are the size of the waves and how much time they take to reach their completion. On this chart, the decline was more powerful than is commonly seen on a routine trading day. Wave 5{-8} began on September 13 from 4175, ended its 3rd subwave three degrees down, wave 3{-11} within its subwave two degrees down, wave 3{-10}, within its first subwave, 1{-9}, all within one day.
That complicates the limited methods the chart offers us to set the degree. Long story short, it’s uncertain how far along the S&P 500 is in wave 5{-8}. It will become clear over time.
The patterns shown on the chart above are of unusual importance for such low degrees, given the vast uncertainties that presently afflict the markets. In good times a trader can track the larger degrees, relaxing throughout the week and checking positions on Mondays. In bad times it pays to keep a closer watch. These aren’t good times.
The big picture, on the other hand, provides a window into the S&P 500’s futures.
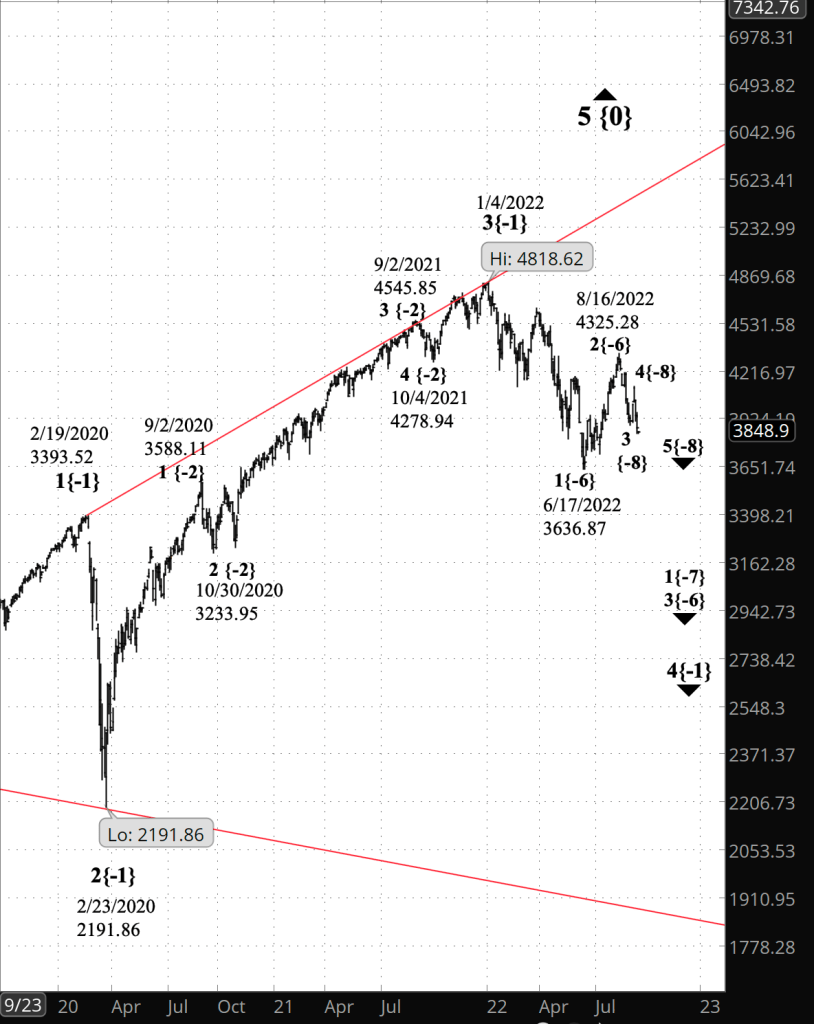
The lower chart shows the S&P 500 index from the start of the early pandemic crash in February 2020 and the long rise that followed, ending with the decline that began on January 4 of the present year.
As the chart shows, the S&P 500 is in a major 4th wave correction, wave 4{-1}, the next-to-the-last leg of an expanding Diagonal Triangle that is the from taken by its parent, uptrending wave, 5{0}, which began in December 2018 from 2346.58. The triangle’s price channel for the triangle appears on the chart as two red lines. The more time passes, the more space there is within that channel for a corrective wave to fall.
Like any downtrend, wave 4{-1} will have its up waves and down that can be traded profitably. For example, the present larger downtrend, wave 3{-6}, began on August 16. It is still underway — bear trade — and will be followed by a 4th wave upward correction, wave 4{-6} — bull trade.
Given the fractal nature of the markets — waves within waves of smaller and larger degree — even major downward corrections provide opportunities for the bullish trader.
And wave 4{-1} will be followed by wave 5{-1}, the final wave of the expanding Diagonal Triangle, which will carry the price back to the constantly rising upper boundary of the triangle’s price channel.
We Are Here.
These are the waves currently in progress under my principal analysis. Each line on the list shows the wave number, with the subscript in curly brackets, the traditional degree name, the starting date, the starting price of the S&P 500 E-mini futures, and the direction of the wave.
- S&P 500 Index:
- 5{+3} Supercycle, 7/8/1932, 4.40 (up)
- 5{+2} Cycle, 12/9/1974, 60.96 (up)
- 5{+1} Primary, 3/6/2009, 666.79 (up)
- 5{0} Intermediate, 12/26/2018, 2346.58 (up)
- 4{-1} Minor, 1/4/2022 4818.62 (down)
- 1{-2} Minute, 1/4/2022 4818.62 (down)
- S&P 500 Futures and index:
- 1{-3} Minuette, 1/4/2022, 4808.25 (down) (futures), 4818.62 (down) (index)
- S&P 500 Futures:
- 1{-4} Subminuette, 1/4/2022, 4808.25 (down)
- 1{-5} Micro, 1/4/2022, 4808.25 (down)
- 3{-6} Submicro, 8/16/2022, 4325.28 (down)
- 1{-7} Minuscule, 8/16/2022, 4325.28 (down)
- 5{-8} Subminuscule, 9/13/2022, 4175 (down)
- 1{-9} (no name), 9/13/2022, 4175 (down)
- 3{-10} (no name), 9/13/2022, 4051.25 (down)
- 5{-11} (no name), 9/15/2022, 3977.50 (down)
Learning and other resources. Elliott wave analysis provides context, not prophecy. As the 20th century semanticist Alfred Korzybski put it in his book Science and Sanity (1933), “The map is not the territory … The only usefulness of a map depends on similarity of structure between the empirical world and the map.” And I would add, in the ever-changing markets, we can judge that similarity of structure only after the fact.
See the menu page Analytical Methods for a rundown on where to go for information on Elliott wave analysis.
By Tim Bovee, Portland, Oregon, September 19, 2022
Disclaimer
Tim Bovee, Private Trader tracks the analysis and trades of a private trader for his own accounts. Nothing in this blog constitutes a recommendation to buy or sell stocks, options or any other financial instrument. The only purpose of this blog is to provide education and entertainment.
No trader is ever 100 percent successful in his or her trades. Trading in the stock and option markets is risky and uncertain. Each trader must make trading decisions for his or her own account, and take responsibility for the consequences.
License
All content on Tim Bovee, Private Trader by Timothy K. Bovee is licensed under a Creative Commons Attribution-ShareAlike 4.0 International License.
Based on a work at www.timbovee.com.

You must be logged in to post a comment.