3:30 p.m. New York time
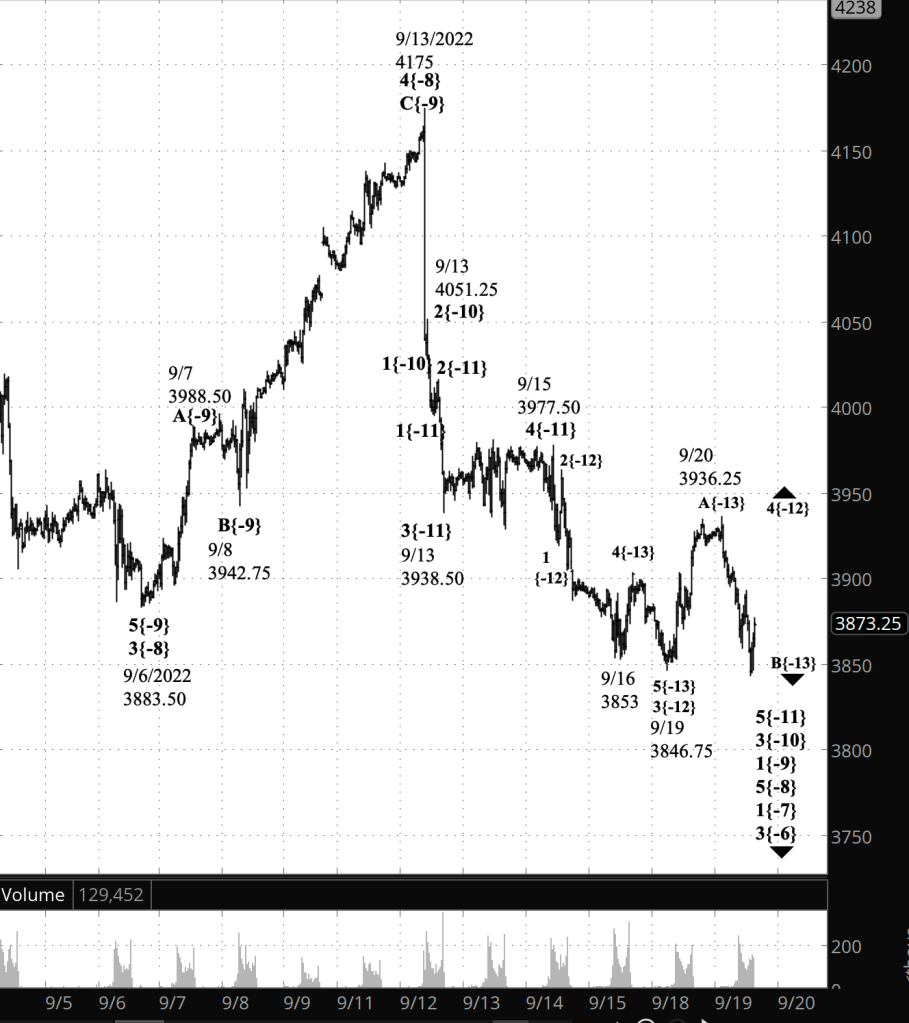
Half an hour before the closing bell. The S&P 500 fell during the session, so far reaching 3843.25 on the futures. The decline, wave B{-13}, brought the price below the beginning of the upward correction, wave 4{-12}. The first wave of the correction, wave A{-13}, has three waves internally, which means that the correction is taking the form of a Flat, the most common corrective form of 4th waves.
If my principal analysis from this morning still matches the reality on the chart, then wave B{-13} will reverse soon, as wave C{-13} carries the price higher, perhaps above this morning’s peak, 3936.25, which was the beginning of declining wave B{-13}. If instead the wave continues to move lower, then the chances increase that the alternative analysis is correct: Wave 5{-12}, a downtrend, is underway. The the price goes, the greater those chances grow.
I’ve updated the chart.
9:35 a.m. New York time
What’s happening now? The S&P 500 E-mini futures reversed sharply in overnight trading and began a decline that has traveled from the peak, 3936.25, down into the 3870s so far.
What does it mean? Under my principal analysis, the peak was the end of the initial wave within an upward correction that began on September 19 and the start of the middle internal wave. This is a change from yesterday’s analysis. I’ll discuss it in detail in the Elliott wave section below.
What is the alternative? The new alternative analysis is yesterday’s principal analysis. The upward correction ended at the overnight high, and the downtrend that began on September 15 is now underway.
What does Elliott wave theory say? Under the principal analysis, wave 4{-11} began from the September 19 low (the end of wave B{-12} under the principal analysis. The overnight high is the end of wave A{-12} within the correction, and wave B{-12} is underway. Wave B{-12} will be followed by rising wave C{-13}, the final wave of the corrective pattern, that may well exceed the overnight high, 3936.25.
Under the alternative analysis, the overnight peak is the end of wave C{-12} within the upward correction, wave 4{-11}. Wave 5{-11} has begun, a downtrending wave within a larger downtrend, wave 3{-10}, which began on September 13.
The internal structure of the waves in an extremely close-up view clarified the wave count. The rise that began on September 19 has five waves internally, as it should if the correction takes the form of a Zigzag. The rise that began on September 16 has three wave internally, which would be the case for a 4th wave, wave 4{-13}, within downtrending wave 3{-12}.
Also, the new principal analysis was wave 3{-11} ending at the low point of the decline. The alternative analysis has wave B{-13}, the middle wave of the correction, moving below the end of wave 3[-12}. This is allowed in a Flat corrective pattern, but under that scenario, the rise that followed, wave C{-13}, must have five waves internally, whether the form is a Zigzag or a Flat. It has three waves internally, and therefore must be an A wave for a Flat.
There are problems with the look of some of the waves; they appear too long or two short of their position in the structure. That has been the case with the entire decline, wave 5{-8}, that began on September 13 and is perhaps an effect of heightened uncertainty, heightened emotion, as traders and algorithms make their decisions. It reminds of the look of the early pandemic crash in 2020 — wave 2{-1} — in which every downtrending wave looked like a straight line and every upward correction like a slip of the pen.
We Are Here.
These are the waves currently in progress under my principal analysis. Each line on the list shows the wave number, with the subscript in curly brackets, the traditional degree name, the starting date, the starting price of the S&P 500 E-mini futures, and the direction of the wave.
- S&P 500 Index:
- 5{+3} Supercycle, 7/8/1932, 4.40 (up)
- 5{+2} Cycle, 12/9/1974, 60.96 (up)
- 5{+1} Primary, 3/6/2009, 666.79 (up)
- 5{0} Intermediate, 12/26/2018, 2346.58 (up)
- 4{-1} Minor, 1/4/2022 4818.62 (down)
- 1{-2} Minute, 1/4/2022 4818.62 (down)
- S&P 500 Futures and index:
- 1{-3} Minuette, 1/4/2022, 4808.25 (down) (futures), 4818.62 (down) (index)
- S&P 500 Futures:
- 1{-4} Subminuette, 1/4/2022, 4808.25 (down)
- 1{-5} Micro, 1/4/2022, 4808.25 (down)
- 3{-6} Submicro, 8/16/2022, 4325.28 (down)
- 1{-7} Minuscule, 8/16/2022, 4325.28 (down)
- 5{-8} Subminuscule, 9/13/2022, 4175 (down)
- 1{-9} (no name), 9/13/2022, 4175 (down)
- 3{-10} (no name), 9/13/2022, 4051.25 (down)
- 5{-11} (no name), 9/15/2022, 3977.50 (down)
Learning and other resources. Elliott wave analysis provides context, not prophecy. As the 20th century semanticist Alfred Korzybski put it in his book Science and Sanity (1933), “The map is not the territory … The only usefulness of a map depends on similarity of structure between the empirical world and the map.” And I would add, in the ever-changing markets, we can judge that similarity of structure only after the fact.
See the menu page Analytical Methods for a rundown on where to go for information on Elliott wave analysis.
By Tim Bovee, Portland, Oregon, September 20, 2022
Disclaimer
Tim Bovee, Private Trader tracks the analysis and trades of a private trader for his own accounts. Nothing in this blog constitutes a recommendation to buy or sell stocks, options or any other financial instrument. The only purpose of this blog is to provide education and entertainment.
No trader is ever 100 percent successful in his or her trades. Trading in the stock and option markets is risky and uncertain. Each trader must make trading decisions for his or her own account, and take responsibility for the consequences.
License
All content on Tim Bovee, Private Trader by Timothy K. Bovee is licensed under a Creative Commons Attribution-ShareAlike 4.0 International License.
Based on a work at www.timbovee.com.

You must be logged in to post a comment.