3:30 p.m. New York time
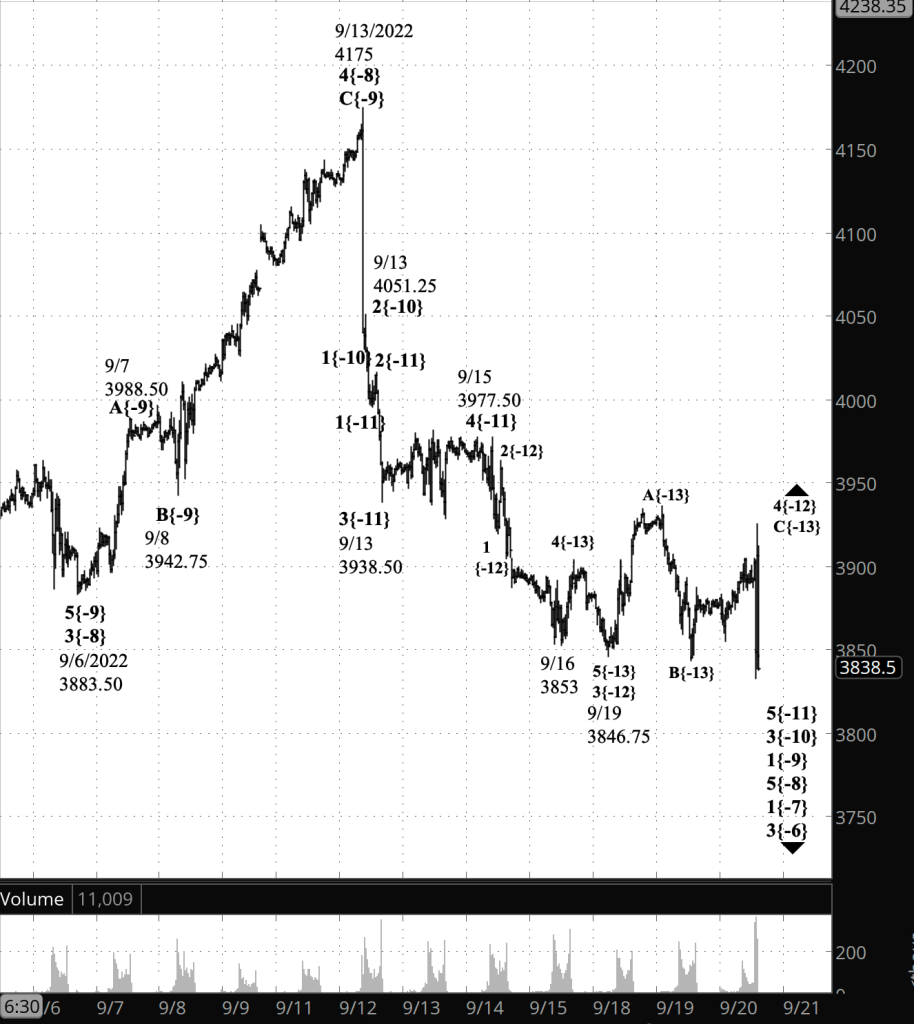
Half an hour before the closing bell. The S&P 500 whipsawed over nearly 100 points as the Federal Open Market Committee announced a 75-basis-point rise in the Fed funds rate. On the futures, the price fell from 3905 to 3832.75, and then rose again to 3925.25 before slipping back sharply.
Rather than selecting a principal analysis for such a move, I shall list the possibilities. Subsequent movements will clarify which is correct.
- Wave C{-13}, the final wave within an upward correction, wave 4{-12}, is underway. Wave 4{-12} is taking the form of a Flat. This was the principal analysis this morning and the one that I used to label the updated chart.
- Wave C{-13} is taking the form of a Triangle, which implies more whipsawing rather than a directional movement.
- Wave 4{-12} is taking a compounds form and the rapid decline was wave X{-13}, a connector wave that is being followed by a second corrective pattern.
- The whipsaw high this afternoon was the end of wave 4{-12} and downtrending wave 5{-12} has begun.
Here is very close-up chart showing the whipsaw. I’ve also updated the chart posted this morning.

2:20 p.m. New York time
DRI earnings play entry. I’ve entered a short bull put vertical spread on DRI, using options that trade for the last time on October 19, and have posted an analysis of the trade.
9:35 a.m. New York time
What’s happening now? The S&P 500 E-mini futures continued tor rise overnight, coming within a quarter point of 3900.
What does it mean? The third and final leg of an upward corrective pattern that began on September 19 is underway. When the correction is complete, it will be followed by a resumption of the downtrend that began on September 15.
What are the alternatives? None as regards the context of the rise set forth in the principal analysis. The alternatives have to do with determining when the upward correction is over. Corrections generally have three segments internally, and if that’s the case with the present correction, then the end or the present rise will also be the end of the correction and the resumption of the downtrend. Sometimes corrections take a compound form, stringing two or three corrective patterns together. If that’s the case here, then the end of the present rise will be followed by a decline that will connect the present corrective pattern with another one.
What does Elliott wave theory say? The present upward correction is wave 4{-12}, and internally, it is in wave C{-13}, the third wave of a corrective pattern called a Flat.
Under the principal analysis, the end of wave C{-13} will also be the end of its parent, wave 4{-12}, and the beginning of downtrending wave 5{-12}, a resumption of the downtrend, wave 5{-11}, that began on September 15 from 3977.50.
Under the alternative analysis, wave 4{-12} will form a compound correction, a not uncommon event within 4th waves. If that occurs, then wave C{-13} will be followed by a connector wave, X{-13}, and then by a wave A{-13}, the first wave within a second corrective pattern. That second pattern may take a different form than did the first, such as a Zigzag or a triangle of some sort. A compound correction can contain up to three corrective patterns, so might end with the second pattern, or have another connector wave and be followed by a third pattern. In any case, once wave 4{-12} is complete, it will be followed by wave 5{-12}, the final wave in a downtrend, wave 5{-11}.
This is all happening within a nested series of downtrends, each larger than the one before: Waves 3{-10}, 1{-9}, 5{-8}, all the way up to wave 1{-2}, the first wave within wave 4{-1}, which began on January 4 from 4808.25. Wave 4{-1} is the next-to-the-last leg of an expanding Diagonal Triangle, wave 5{0}, that began on December 26, 2018, from 2346.58. Wave 4{-1} will be followed by wave 5{-1}, the rising final wave of the triangle that will carry the price the January 4 high, perhaps significantly higher.
We Are Here.
These are the waves currently in progress under my principal analysis. Each line on the list shows the wave number, with the subscript in curly brackets, the traditional degree name, the starting date, the starting price of the S&P 500 E-mini futures, and the direction of the wave.
- S&P 500 Index:
- 5{+3} Supercycle, 7/8/1932, 4.40 (up)
- 5{+2} Cycle, 12/9/1974, 60.96 (up)
- 5{+1} Primary, 3/6/2009, 666.79 (up)
- 5{0} Intermediate, 12/26/2018, 2346.58 (up)
- 4{-1} Minor, 1/4/2022 4818.62 (down)
- 1{-2} Minute, 1/4/2022 4818.62 (down)
- S&P 500 Futures and index:
- 1{-3} Minuette, 1/4/2022, 4808.25 (down) (futures), 4818.62 (down) (index)
- S&P 500 Futures:
- 1{-4} Subminuette, 1/4/2022, 4808.25 (down)
- 1{-5} Micro, 1/4/2022, 4808.25 (down)
- 3{-6} Submicro, 8/16/2022, 4325.28 (down)
- 1{-7} Minuscule, 8/16/2022, 4325.28 (down)
- 5{-8} Subminuscule, 9/13/2022, 4175 (down)
- 1{-9} (no name), 9/13/2022, 4175 (down)
- 3{-10} (no name), 9/13/2022, 4051.25 (down)
- 5{-11} (no name), 9/15/2022, 3977.50 (down)
Learning and other resources. Elliott wave analysis provides context, not prophecy. As the 20th century semanticist Alfred Korzybski put it in his book Science and Sanity (1933), “The map is not the territory … The only usefulness of a map depends on similarity of structure between the empirical world and the map.” And I would add, in the ever-changing markets, we can judge that similarity of structure only after the fact.
See the menu page Analytical Methods for a rundown on where to go for information on Elliott wave analysis.
By Tim Bovee, Portland, Oregon, September 21, 2022
Disclaimer
Tim Bovee, Private Trader tracks the analysis and trades of a private trader for his own accounts. Nothing in this blog constitutes a recommendation to buy or sell stocks, options or any other financial instrument. The only purpose of this blog is to provide education and entertainment.
No trader is ever 100 percent successful in his or her trades. Trading in the stock and option markets is risky and uncertain. Each trader must make trading decisions for his or her own account, and take responsibility for the consequences.
License
All content on Tim Bovee, Private Trader by Timothy K. Bovee is licensed under a Creative Commons Attribution-ShareAlike 4.0 International License.
Based on a work at www.timbovee.com.

You must be logged in to post a comment.