3:30 p.m. New York time
Half an hour before the closing bell. The S&P 500 fell below Thursday’s low, 3660.25 on the futures. The shortness of the preceding rise and the depth of the fall suggest that wave B{-10} within an upward correction, wave 4{-9}, is still underway. This was the alternative scenario in this morning’s analysis, and I’ve changed the upper chart’s labeling to conform.
9:35 a.m. New York time
What’s happening now? The S&P 500 E-mini futures rose overnight into the 3690s and then declined back into the 3640s.
What does it mean? The first leg of an upward correction that began on September 28 is underway and appears to now be in its third internal wave.
What are the alternatives? The third internal wave seems to be overly small, and so it may well be a movement of an even smaller degree, perhaps continuing second internal wave.
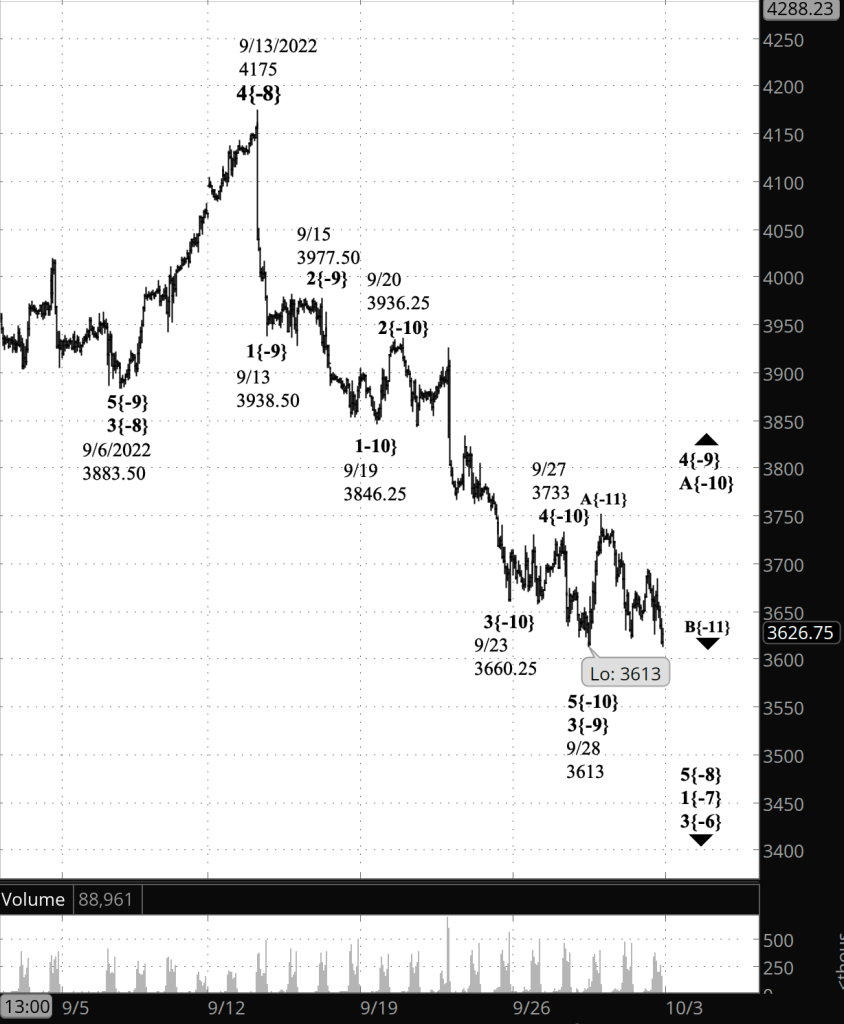
What does Elliott wave theory say? By my principal analysis, upward wave C{-11} is underway. It is enclosed by upward wave A{-10} within an upward correction, wave 4{-9}. The alternative analysis speculates that wave C{-11} is actually part of the preceding downward wave, B{-11}, which is not yet complete.
This is all happening within a series of increasingly larger downtrending waves, nested like Russian matryoshka dolls. The waves range from 5{-8}, which began on September 13 from 4175 on the futures, up to descending wave 4{-1}, which began on January 4 from 4918.62 in the index. The entire series is contained within an expanding Diagonal Triangle, wave 5{0}, which began on December 26, 2018. Wave 4{-1} will be followed by an ascending wave, 5{-1}, that will carry the price to new highs and, when complete, will also be the endpoint of the Triangle.
This chart shows the Diagonal Triangle in its entirety so far. The red lines are the Triangle’s price-channel boundaries.

We Are Here.
These are the waves currently in progress under my principal analysis. Each line on the list shows the wave number, with the subscript in curly brackets, the traditional degree name, the starting date, the starting price of the S&P 500 E-mini futures, and the direction of the wave.
- S&P 500 Index:
- 5{+3} Supercycle, 7/8/1932, 4.40 (up)
- 5{+2} Cycle, 12/9/1974, 60.96 (up)
- 5{+1} Primary, 3/6/2009, 666.79 (up)
- 5{0} Intermediate, 12/26/2018, 2346.58 (up)
- 4{-1} Minor, 1/4/2022 4818.62 (down)
- 1{-2} Minute, 1/4/2022 4818.62 (down)
- S&P 500 Futures and index:
- 1{-3} Minuette, 1/4/2022, 4808.25 (down) (futures), 4818.62 (down) (index)
- S&P 500 Futures:
- 1{-4} Subminuette, 1/4/2022, 4808.25 (down)
- 1{-5} Micro, 1/4/2022, 4808.25 (down)
- 3{-6} Submicro, 8/16/2022, 4325.28 (down)
- 1{-7} Minuscule, 8/16/2022, 4325.28 (down)
- 5{-8} Subminuscule, 9/13/2022, 4175 (down)
Learning and other resources. Elliott wave analysis provides context, not prophecy. As the 20th century semanticist Alfred Korzybski put it in his book Science and Sanity (1933), “The map is not the territory … The only usefulness of a map depends on similarity of structure between the empirical world and the map.” And I would add, in the ever-changing markets, we can judge that similarity of structure only after the fact.
See the menu page Analytical Methods for a rundown on where to go for information on Elliott wave analysis.
By Tim Bovee, Portland, Oregon, September 30, 2022
Disclaimer
Tim Bovee, Private Trader tracks the analysis and trades of a private trader for his own accounts. Nothing in this blog constitutes a recommendation to buy or sell stocks, options or any other financial instrument. The only purpose of this blog is to provide education and entertainment.
No trader is ever 100 percent successful in his or her trades. Trading in the stock and option markets is risky and uncertain. Each trader must make trading decisions for his or her own account, and take responsibility for the consequences.
License
All content on Tim Bovee, Private Trader by Timothy K. Bovee is licensed under a Creative Commons Attribution-ShareAlike 4.0 International License.
Based on a work at www.timbovee.com.

You must be logged in to post a comment.