3:30 p.m. New York time
Half an hour before the closing bell. The S&P 500 continued to rise during the session, reaching into the 3710s on the futures. The upward reversal confirms this morning’s principal analysis and eliminates the alternative analysis. In Elliott wave terminology, wave C{-11} within wave A{-10} within wave 4{-9}, an upward correction, are underway. I’ve updated the chart.
9:35 a.m. New York time
What’s happening now? The S&P 500 E-mini futures fell overnight, to 3571.75, and then rose, reaching back into the 3640s.
What does it mean? The overnight low ended the second leg of an upward correction within the first leg of a larger upward correction.
What are the alternatives? If the price reverses and falls significantly lower, with five waves internally, then it means that the larger correction is in fact over and the downtrend has resumed, requiring a reanalysis of the decline from September 20.
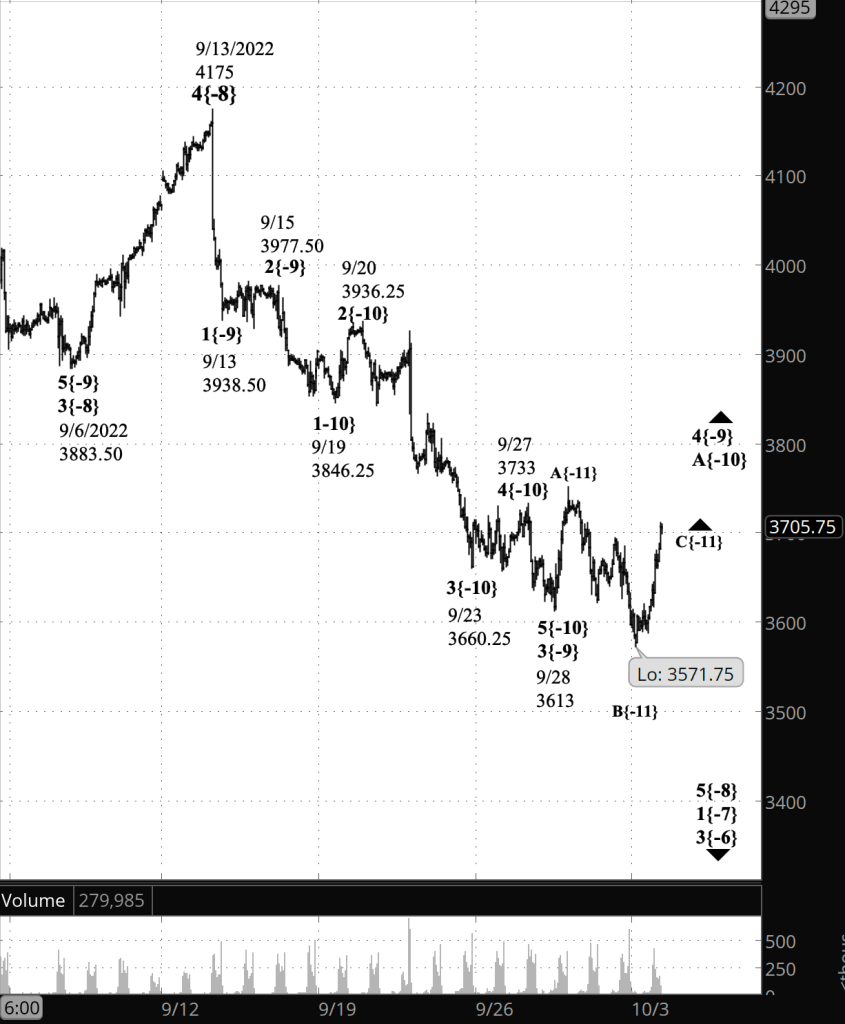
What does Elliott wave theory say? Under the principal analysis, wave A{-10}, an upward correction within wave 4{-9}, has been underway since September 28. Wave A{-10} has three waves internally if the parent wave’s pattern in a Flat, or five waves if it is a Zigzag. It has completed two waves, A{-11} and B{-11}, and has begun wave C{-11}. If the pattern is a Flat, then the present wave C{-11} is the end of wave A{-10} and will be followed by a declining wave B{-10}. If the pattern is a Zigzag, then wave C{-11} will be followed by two more waves, waves D{-11} and E{-11}. After E{-11} is complete, then wave B{-11} will continue the larger wave 4{-9}.
The overnight price fell below the start of wave 4{-9}, and although such a fall below the starting point isn’t done in 2nd waves, it happens routinely in 4th waves. A short rising wave C{-11} and then a large decline would, however, trigger the alternative count: Wave 4{-9} ended on September 28, at the peak of what is now labeled wave A{-11} on the principal analysis, and wave 5{-9} has begun.
The recount would most likely put the end of wave 4{-10} at the peak of what is now wave A{-11} and label the ensuing decline as wave 5{-10}.
All of this is happening within downtrending wave 5{-8}, which began on September 13 from 4175, the low wave of a nested series of downtrending waves stretching up seven degrees, to declining wave 4{-1}, which began on January 4 from 4818.62, the next to the last wave within an expanding Diagonal Triangle, wave 5{0}, that began on December 26, 2018, from 2346.58 on the index. Wave 4{-1} will be followed by rising wave 5{-1}, which will carry the price above the January 4 start of wave 4{-1}, perhaps significantly higher.
We Are Here.
These are the waves currently in progress under my principal analysis. Each line on the list shows the wave number, with the subscript in curly brackets, the traditional degree name, the starting date, the starting price of the S&P 500 E-mini futures, and the direction of the wave.
- S&P 500 Index:
- 5{+3} Supercycle, 7/8/1932, 4.40 (up)
- 5{+2} Cycle, 12/9/1974, 60.96 (up)
- 5{+1} Primary, 3/6/2009, 666.79 (up)
- 5{0} Intermediate, 12/26/2018, 2346.58 (up)
- 4{-1} Minor, 1/4/2022 4818.62 (down)
- 1{-2} Minute, 1/4/2022 4818.62 (down)
- S&P 500 Futures and index:
- 1{-3} Minuette, 1/4/2022, 4808.25 (down) (futures), 4818.62 (down) (index)
- S&P 500 Futures:
- 1{-4} Subminuette, 1/4/2022, 4808.25 (down)
- 1{-5} Micro, 1/4/2022, 4808.25 (down)
- 3{-6} Submicro, 8/16/2022, 4325.28 (down)
- 1{-7} Minuscule, 8/16/2022, 4325.28 (down)
- 5{-8} Subminuscule, 9/13/2022, 4175 (down)
Learning and other resources. Elliott wave analysis provides context, not prophecy. As the 20th century semanticist Alfred Korzybski put it in his book Science and Sanity (1933), “The map is not the territory … The only usefulness of a map depends on similarity of structure between the empirical world and the map.” And I would add, in the ever-changing markets, we can judge that similarity of structure only after the fact.
See the menu page Analytical Methods for a rundown on where to go for information on Elliott wave analysis.
By Tim Bovee, Portland, Oregon, October 3, 2022
Disclaimer
Tim Bovee, Private Trader tracks the analysis and trades of a private trader for his own accounts. Nothing in this blog constitutes a recommendation to buy or sell stocks, options or any other financial instrument. The only purpose of this blog is to provide education and entertainment.
No trader is ever 100 percent successful in his or her trades. Trading in the stock and option markets is risky and uncertain. Each trader must make trading decisions for his or her own account, and take responsibility for the consequences.
License
All content on Tim Bovee, Private Trader by Timothy K. Bovee is licensed under a Creative Commons Attribution-ShareAlike 4.0 International License.
Based on a work at www.timbovee.com.

You must be logged in to post a comment.