3:30 p.m. New York time
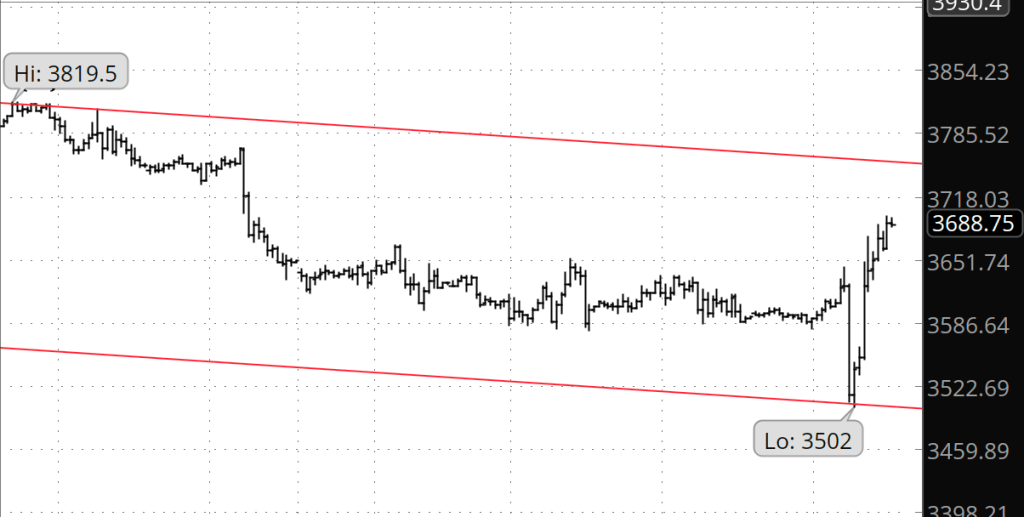
Half an hour before the closing bell. The S&P 500 rose sharply during the session after a sharp fall before the opening bell when new inflation numbers were released. The way I count it at that low degree, the decline to 3502 was the final wave within wave 5{-9}, which also completed waves 5{-8} and 1{-7}, and the subsequent rise was the begining wave wave 2{-7}, a large upawrd correction.
I’ve added a chart of the S&P 500 futures with 45-minute bars showing the fall and rise, and I’ve updated the upper chart further down.
3:15 p.m. New York time
MS earnings play entry. I’ve entered a short bear call spread on MS, using options that trade for the last time on November 18, and have posted an analysis of the trade.
3:05 p.m. New York time
JPM earnings play entry. I’ve entered a short bear call spread on JPM, using options that trade for the last time on November 18, and have posted an analysis of the trade.
10:05 a.m. New York time
DAL earnings play exit. I’ve exited a short bear call options spread on DAL for a wash — neither a profit nor loss — as the stock price seesawed wildly in the minutes after the opening bell. I’ve updated the trade analysis with the outcome
9:35 a.m. New York time
What’s happening now? The S&P 500 E-mini futures traded within a narrow range overnight until the release of the latest U.S. inflation numbers an hour before the opening bell. At that point, the price dropped 116.75 points in one minute, a decline of 3.2%.
What does it mean? Markets respond to changes in the public mood, and whether the changes are rapid or slow, the prices traced on the charts match the patterns discovered by R.N. Elliott in the 1930s. In this case, the rapid decline is the final leg of a downtrend that began on October 5 from 3820, and that is itself the final leg of a larger downtrend that began on October 13 from 4175.
The sudden overnight drop brought the price to within a few points of the lower boundary of the price channel for the decline from October 5, marked in red on the upper chart.
The final leg of a trend often lacks respect for the targets implied by price channels, coming up short, moving far beyond, or hitting the target precisely. It’s like the porridge in “Goldilocks and the Three Bears” — too cold, too hot or just right.
That’s a long way of saying that while the final leg of the downtrend could be ending right where the price is, there’s no guarantee that it won’t decline further, perhaps by a significant distance.
What are the alternatives? The present ambiguities arise from the Goldilocks conundrum described above: Has the downtrended ended yet? What is the state of the porridge? And the answer at present is that the porridge seems just right — the final leg of the downtrend will end close to the price channel — but we can’t know that for sure.
The charts. The upper chart, of the S&P 500 futures, shows the downtrend that began on September 13. The lower chart, of the S&P 500 index, shows the entirely of the expanding Diagonal Triangle that began in December 2018.
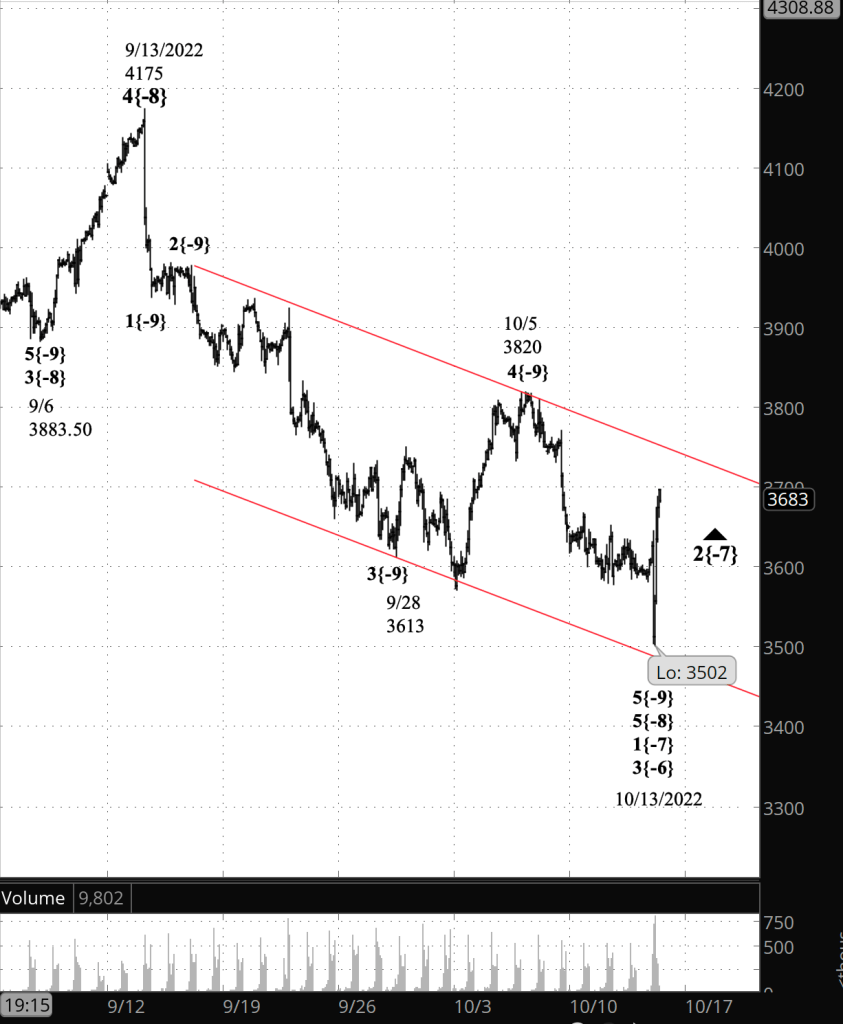
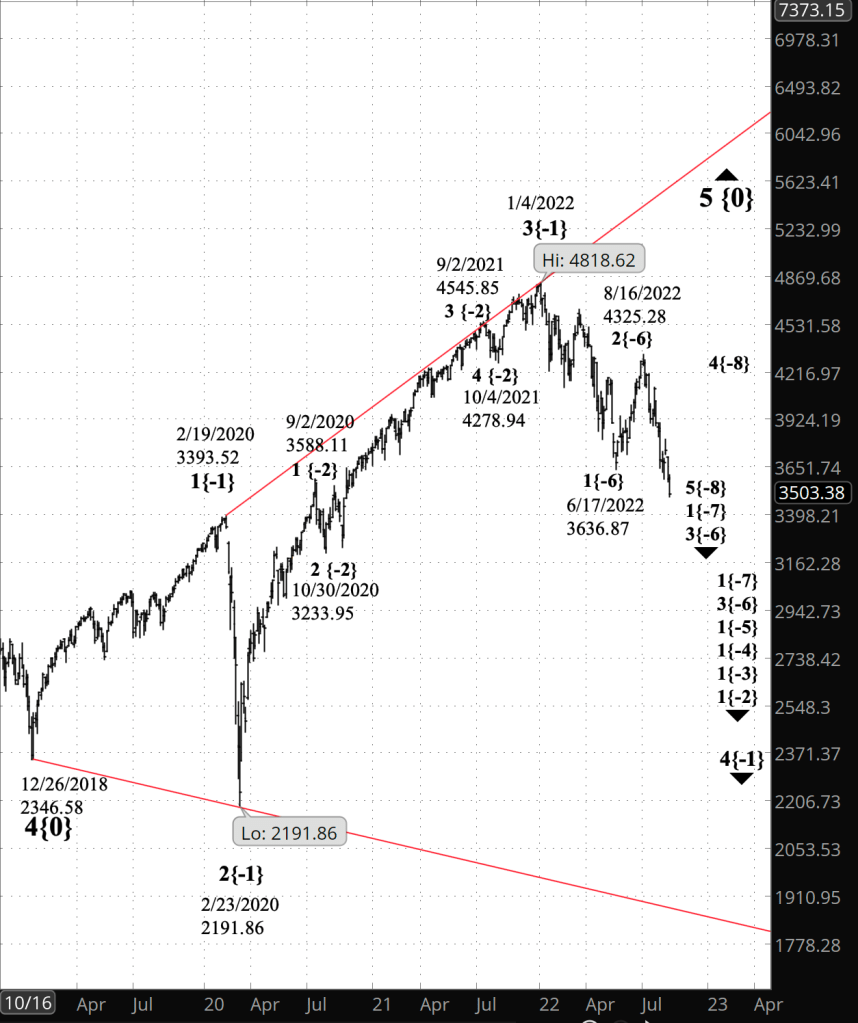
What does Elliott wave theory say? The overnight decline is wave 5{-10} within the larger wave 5{-9}, which began on October 5. The whole structure is contained within a series of nested waves of increasing size: Wave 5{-8}, which began on September 13, within wave 1{-7} within wave 3{-6}, both of which which began on August 16 from 4327.50 — and so forth, up to wave 4{-1}, which began on January 4 and is the next to the last component of wave 5{0}, an expanding Diagonal Triangle that began on December 26, 2018.
All of the waves in this structure, up through wave 4{-1}, are downtrending. Wave 5{0} is an uptrending wave, although the expanding Diagonal Triangle pattern means that the prices swing from highest to lowest and back to an even higher highest and then to a lower lowest. The Diagonal Triangle price channel is shown in red on the lower chart.
Given the fractal nature of price levels — “degrees” in Elliott wave parlance — the end of a smaller wave can also be the end of a larger wave. So the end of wave 5{-10} will also be the end of wave 5{-9} and also of 5{-8} and 1{-7}.
Wave 1{-7} will be followed by an upward correction larger than those we’ve seen this autumn, and then by a decline, also larger than those of recent memory.
We Are Here.
These are the waves currently in progress under my principal analysis. Each line on the list shows the wave number, with the subscript in curly brackets, the traditional degree name, the starting date, the starting price of the S&P 500 E-mini futures, and the direction of the wave.
- S&P 500 Index:
- 5{+3} Supercycle, 7/8/1932, 4.40 (up)
- 5{+2} Cycle, 12/9/1974, 60.96 (up)
- 5{+1} Primary, 3/6/2009, 666.79 (up)
- 5{0} Intermediate, 12/26/2018, 2346.58 (up)
- 4{-1} Minor, 1/4/2022 4818.62 (down)
- 1{-2} Minute, 1/4/2022 4818.62 (down)
- S&P 500 Futures and index:
- 1{-3} Minuette, 1/4/2022, 4808.25 (down) (futures), 4818.62 (down) (index)
- S&P 500 Futures:
- 1{-4} Subminuette, 1/4/2022, 4808.25 (down)
- 1{-5} Micro, 1/4/2022, 4808.25 (down)
- 3{-6} Submicro, 8/16/2022, 4327.50 (down)
- 1{-7} Minuscule, 8/16/2022, 4327.50 (down)
- 5{-8} Subminuscule, 9/13/2022, 4175 (down)
Learning and other resources. Elliott wave analysis provides context, not prophecy. As the 20th century semanticist Alfred Korzybski put it in his book Science and Sanity (1933), “The map is not the territory … The only usefulness of a map depends on similarity of structure between the empirical world and the map.” And I would add, in the ever-changing markets, we can judge that similarity of structure only after the fact.
See the menu page Analytical Methods for a rundown on where to go for information on Elliott wave analysis.
By Tim Bovee, Portland, Oregon, October 13, 2022
Disclaimer
Tim Bovee, Private Trader tracks the analysis and trades of a private trader for his own accounts. Nothing in this blog constitutes a recommendation to buy or sell stocks, options or any other financial instrument. The only purpose of this blog is to provide education and entertainment.
No trader is ever 100 percent successful in his or her trades. Trading in the stock and option markets is risky and uncertain. Each trader must make trading decisions for his or her own account, and take responsibility for the consequences.
License
All content on Tim Bovee, Private Trader by Timothy K. Bovee is licensed under a Creative Commons Attribution-ShareAlike 4.0 International License.
Based on a work at www.timbovee.com.

You must be logged in to post a comment.