3:30 p.m. New York time
Half an hour before the closing bell. The S&P 500 has drawn back from the day’s high, 3733.75 on the futures, into the low 3600s. The pullback is a wave within the early phases of the first leg of an upward correction that began on October 13. In Elliott wave terms, an upward correction, wave 2{-7}, began on October 13. It is now in its first wave, rising wave A{-8}, and A{-8}’s second internal segment, declining wave 2{-9}, is presently underway. It could also possibly be one degree lower. No change in the analysis. I’ve updated the chart.
3:25 p.m. New York time
Earnings play BAC entry. I’ve entered a short bear call spread earnings play on BAC, using options that expire on November 18, and have posted an analysis of the trade.
1:35 p.m. New York time
Earnings plays JPM and MS exits. I’ve exited my short bear call options spreads on two symbols, JPM for 94% of maximum potential loss and MS for 24.1% of maximum potential profit. I’ve updated both trade analyses with full results, for JPM and MS.
9:35 a.m. New York time
What’s happening now? The S&P 500 E-mini futures traded sideways overnight, ranging from the 3660s to the 3730s, and then rose higher at the opening bell.
What does it mean? An upward correction that began yesterday, October 13, has reached its first pausing point, near the 23.6% Fibonacci retracement level. I’ve placed a Fibonacci retracement ladder on the chart in red to better track the progress of the correction.
The correction is the first within the downtrend that began on August 16 from 4327.50. The first correction in a trend tends to take back much of the ground covered by the first leg of the trend. However, it can’t move beyond the start of the trend, setting a firm upper boundary on this correction at 4327.50.
The major Fibonacci retracement levels are often end points of a correction and of subwaves within a correction. Three likely end points that satisfy the tendency to retrace a great deal of the preceding trend are around the 78.6% Fibonacci retracement level (4150.84), the 61.8% level (4012.16), or the 50% level (3914.75). Those potential endpoints represent tendencies, not certainties.
What are the alternatives?
Alternative #1: It’s possible, although I don’t consider it to be likely, that the upward movement that began yesterday is part of a smaller upward correction that began on September 28 from 3613. If this proves to be the case, then the rise would be the third and final wave of the correction.
Alternative #2: Also an unlikely possibility in my view. Under this scenario, the October 5 peak was indeed the end of a corrective pattern, but the upward correction is taking a compound form. The subsequent decline was a wave connecting the first corrective pattern with a second corrective pattern, and the rise that began yesterday is the first leg of that second corrective pattern.
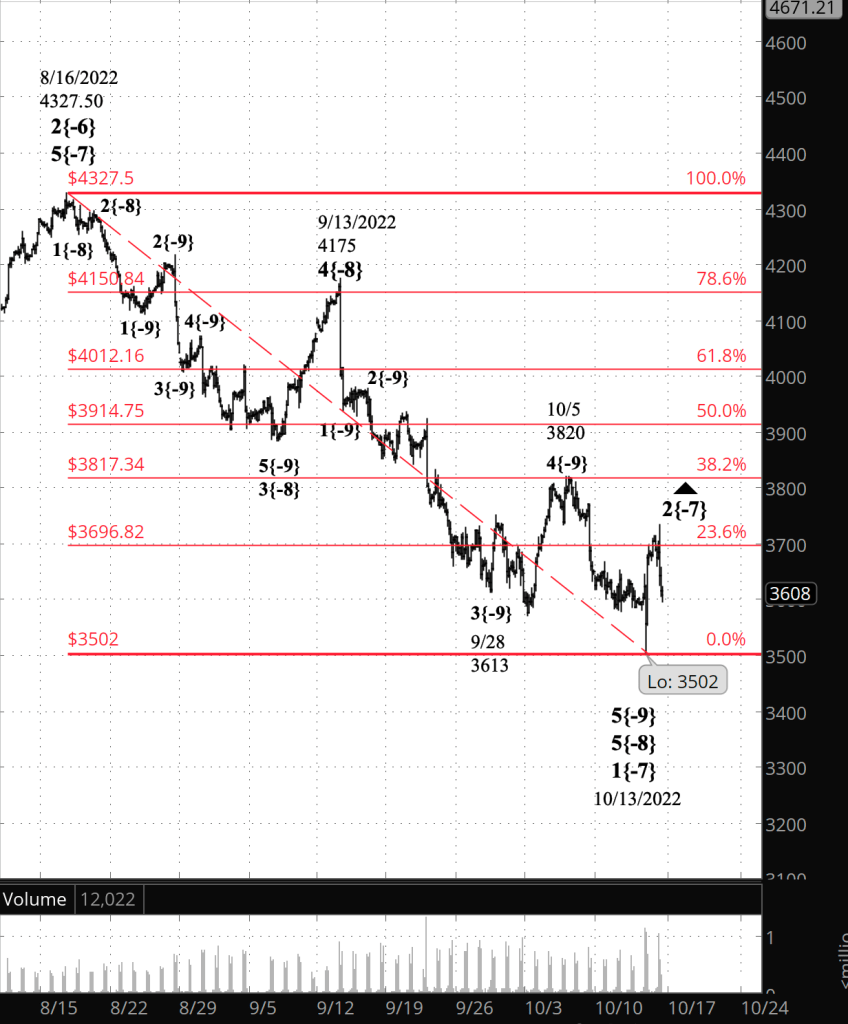
What does Elliott wave theory say? Under the principal analysis, wave 2{-7} began yesterday from 3502 and is retracing the preceding downtrend, wave 1{-7}, which began on August 16 from 4327.50. A 2nd wave never moves beyond the starting point of the preceding 1st wave, which was 4327.50 for wave 1{-7}. That price is a firm limit for wave 2{-7}.
A 2nd wave almost always will take a Zigzag pattern. Wave 2{-7} is presently within its first leg, rising wave A{-8}, which will have five waves internally. Falling wave B{-8} will follow, with three internal aves, and rising wave C{-8} will complete the corrective pattern, with five waves internally.
The Zigzag pattern in a tendency, not a rule. Sometimes 2nd waves will take other forms. Also, rarely, they’ll take a compound structure.
The fact that the price reversed strongly from the lower boundary of wave 1{-7} gives me a great deal of confidence that the principal analysis is correct: Wave 2{-7} is underway. However, in market analysis, there are always ambiguities and alternatives. Elliott wave analysis, unlike many other methods, openly acknowledges and analyzes those other ways of interpreting a chart.
Under the first alternative analysis, wave 4{-9}, an upward correction that began on September 28, is still underway. The rise that began yesterday is its third wave internally, wave C{-10}, which will complete the correction.
Under the second alternative analysis, wave 4{-9} has taken a compound structure. The October 5 peak was the end of wave C{-10} and of the first corrective pattern. The subsequent decline to 3502 is a connector, wave X{-10}, and the rise that followed is wave A{-10}, the first wave of the second corrective pattern, which is still progress is wave. Compound corrections can have up to three corrective patterns.
We Are Here.
These are the waves currently in progress under my principal analysis. Each line on the list shows the wave number, with the subscript in curly brackets, the traditional degree name, the starting date, the starting price of the S&P 500 E-mini futures, and the direction of the wave.
- S&P 500 Index:
- 5{+3} Supercycle, 7/8/1932, 4.40 (up)
- 5{+2} Cycle, 12/9/1974, 60.96 (up)
- 5{+1} Primary, 3/6/2009, 666.79 (up)
- 5{0} Intermediate, 12/26/2018, 2346.58 (up)
- 4{-1} Minor, 1/4/2022 4818.62 (down)
- 1{-2} Minute, 1/4/2022 4818.62 (down)
- S&P 500 Futures and index:
- 1{-3} Minuette, 1/4/2022, 4808.25 (down) (futures), 4818.62 (down) (index)
- S&P 500 Futures:
- 1{-4} Subminuette, 1/4/2022, 4808.25 (down)
- 1{-5} Micro, 1/4/2022, 4808.25 (down)
- 3{-6} Submicro, 8/16/2022, 4327.50 (down)
- 2{-7} Minuscule, 10/13/2022, 3502 (up)
- A{-8} Subminuscule, 10/13/2022, 3502 (up)
Learning and other resources. Elliott wave analysis provides context, not prophecy. As the 20th century semanticist Alfred Korzybski put it in his book Science and Sanity (1933), “The map is not the territory … The only usefulness of a map depends on similarity of structure between the empirical world and the map.” And I would add, in the ever-changing markets, we can judge that similarity of structure only after the fact.
See the menu page Analytical Methods for a rundown on where to go for information on Elliott wave analysis.
By Tim Bovee, Portland, Oregon, October 14, 2022
Disclaimer
Tim Bovee, Private Trader tracks the analysis and trades of a private trader for his own accounts. Nothing in this blog constitutes a recommendation to buy or sell stocks, options or any other financial instrument. The only purpose of this blog is to provide education and entertainment.
No trader is ever 100 percent successful in his or her trades. Trading in the stock and option markets is risky and uncertain. Each trader must make trading decisions for his or her own account, and take responsibility for the consequences.
License
All content on Tim Bovee, Private Trader by Timothy K. Bovee is licensed under a Creative Commons Attribution-ShareAlike 4.0 International License.
Based on a work at www.timbovee.com.

You must be logged in to post a comment.