3:30 p.m. New York time
Half an hour before the closing bell. The S&P 500 rose during the session, reaching a high so far of 3702.50 on the futures. It then paused, fluctuating sideways along the 23.6% Fibonacci retracement level. No change in the analysis, but chart has added an ambiguity.
If the upward correction, wave 2{-7}, is taking the the from of a Zigzag, then the pause is wave C{-9} within wave A{-8}, with waves D and E at the {-9} level remaining. If wave 2{-7} is taking the form of a Flat, then the peak may have marked the end of wave A{-8} and the subsequent pause would be the early stages of wave B{-8}. Or, possibly, wave C{-9} within A{-8} still has further to rise.
I have no opinion on whether wave C{-9} is complete. However, I think the Zigzag scenario is more likely, for two reasons:
(1) Zigzags are a more common pattern than Flats for 2nd waves
(2) Second waves typically cover a lot of ground in the direction of the correction, and the first wave of the correction hasn’t gone very far yet.
11:05 a.m. New York time
BAC earnings play exit. I’ve exited my short bull put options spread on BAC for 97.5% of maximum potential loss and have updated the trade analysis with results.
9:35 a.m. New York time
What’s happening now? In overnight trading, the S&P 500 E-mini futures reversed from Friday’s low, 3590.50, rising into the 3670s.
What does it mean? An upward correction that began on October 13 is in its first leg, which can be expected to have five segments internally, if the correction takes the form of a Zigzag, or three segments, if the correction takes the form of a Flat. The correction’s first leg is presently in its third internal segment.
The correction is part the downtrend that began on August 16 from 4327.50. This is the first correction iwithin the downtrend and can be expected to retrace a significant portion of the preceding decline.
I’ve placed a Fibonacci retracement ladder on the chart, in red, making it easier to see how much of the decline has been retraced by the correction. The first segment within the first leg of the correction carried the price up to the 23.6% Fibonaci level. For the correction as a whole, a retracement up to the 61.8% or 78.6% Fibonacci levels would not be unusual.
What are the alternatives? As always in the early stages of a market movement, the labeling of the ups and downs compared to larger or smaller movements is a best guess. I’ve placed the correction in its entirety at one level smaller than the downtrend, which seems proportional in size and time to what has occurred before. Nonetheless, the chart could play out in such a way as to require a change in the labeling.
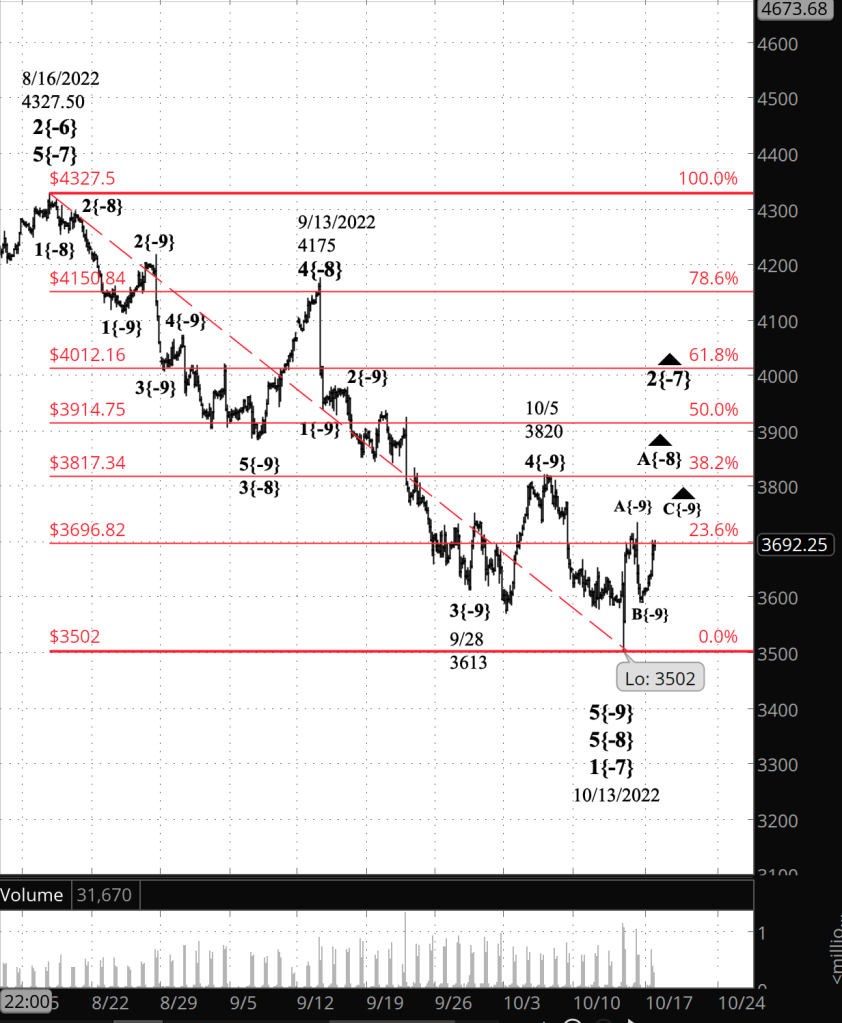
What does Elliott wave theory say? The upward correction is wave 2{-7] within a downtrend, wave 3{-6}. As noted a above, 2nd waves tend to take retrace much of the distance covered by the preceding 1st wave. Also, 3rd waves tend to be the longest wave within a trend. So there is energy both to the upside and the downside.
Internally, wave 2{-7} is in its initial wave, wave A{-8}, which in turn is in its third segment, wave C{-9}, the latter being an uptrending wave that began from Friday’s low.
Wave A{-8} will be followed by downtrending wave B{-8} and then a final push to the upside with wave C{-8}, which will complete the corrective pattern. Although not necessarily the correction, which could be extended in a compound structure.
We Are Here.
These are the waves currently in progress under my principal analysis. Each line on the list shows the wave number, with the subscript in curly brackets, the traditional degree name, the starting date, the starting price of the S&P 500 E-mini futures, and the direction of the wave.
- S&P 500 Index:
- 5{+3} Supercycle, 7/8/1932, 4.40 (up)
- 5{+2} Cycle, 12/9/1974, 60.96 (up)
- 5{+1} Primary, 3/6/2009, 666.79 (up)
- 5{0} Intermediate, 12/26/2018, 2346.58 (up)
- 4{-1} Minor, 1/4/2022 4818.62 (down)
- 1{-2} Minute, 1/4/2022 4818.62 (down)
- S&P 500 Futures and index:
- 1{-3} Minuette, 1/4/2022, 4808.25 (down) (futures), 4818.62 (down) (index)
- S&P 500 Futures:
- 1{-4} Subminuette, 1/4/2022, 4808.25 (down)
- 1{-5} Micro, 1/4/2022, 4808.25 (down)
- 3{-6} Submicro, 8/16/2022, 4327.50 (down)
- 2{-7} Minuscule, 10/13/2022, 3502 (up)
- A{-8} Subminuscule, 10/13/2022, 3502 (up)
Learning and other resources. Elliott wave analysis provides context, not prophecy. As the 20th century semanticist Alfred Korzybski put it in his book Science and Sanity (1933), “The map is not the territory … The only usefulness of a map depends on similarity of structure between the empirical world and the map.” And I would add, in the ever-changing markets, we can judge that similarity of structure only after the fact.
See the menu page Analytical Methods for a rundown on where to go for information on Elliott wave analysis.
By Tim Bovee, Portland, Oregon, October 17, 2022
Disclaimer
Tim Bovee, Private Trader tracks the analysis and trades of a private trader for his own accounts. Nothing in this blog constitutes a recommendation to buy or sell stocks, options or any other financial instrument. The only purpose of this blog is to provide education and entertainment.
No trader is ever 100 percent successful in his or her trades. Trading in the stock and option markets is risky and uncertain. Each trader must make trading decisions for his or her own account, and take responsibility for the consequences.
License
All content on Tim Bovee, Private Trader by Timothy K. Bovee is licensed under a Creative Commons Attribution-ShareAlike 4.0 International License.
Based on a work at www.timbovee.com.

You must be logged in to post a comment.