3:30 p.m. New York time
Half an hour before the closing bell. The S&P 500 reached 3746.50 on the futures during the session and then reversed, returning to the 23.6% retracement level, 50 points below.
The analysis from this morning is unchanged. The upward correction that began on October 13, wave 2{-7}, is still underway and is in its initial phase, rising wave A{-8}.
I’ve updated the chart.
2:35 p.m. New York time
ABT earnings play entry. I’ve entered a bull put spread on ABT, using options that trade for the last time on November 18, and have posted an analysis of the trade.
2:05 p.m. New York time
UAL earnings play entry. I’ve entered a bull put spread on UAL, using options that trade for the last time on November 18, and have posted an analysis of the trade.
9:35 a.m. New York time
What’s happening now? The S&P 500 E-mini futures broke free from its stall in the 3690s, rising to the 3770s.
What does it mean? The third segment within the first leg of an upward correction that began on October 13 continues, carrying to price more than halfway toward the 38.2% Fibonacci retracement level. (I’ve placed a Fibonacci retracement ladder on the chart, in red.) The present rise, which began on October 16, will be followed by a decline and then a further rise to complete the correction’s first leg.
What are the alternatives? The ambiguity on the chart is whether the present rise will be the end of the first, rising portion of the upward correction, or whether there will be another decline and rise after it is complete. If the correction as a whole takes the form of a Zigzag, it will have five segments within its initial rise, as in the principal anaysis. Under the alternative analysis, it will take the from of a Flat, with three segments within the initial leg., and the end of the present rise will also be the end of the first leg of the correction.
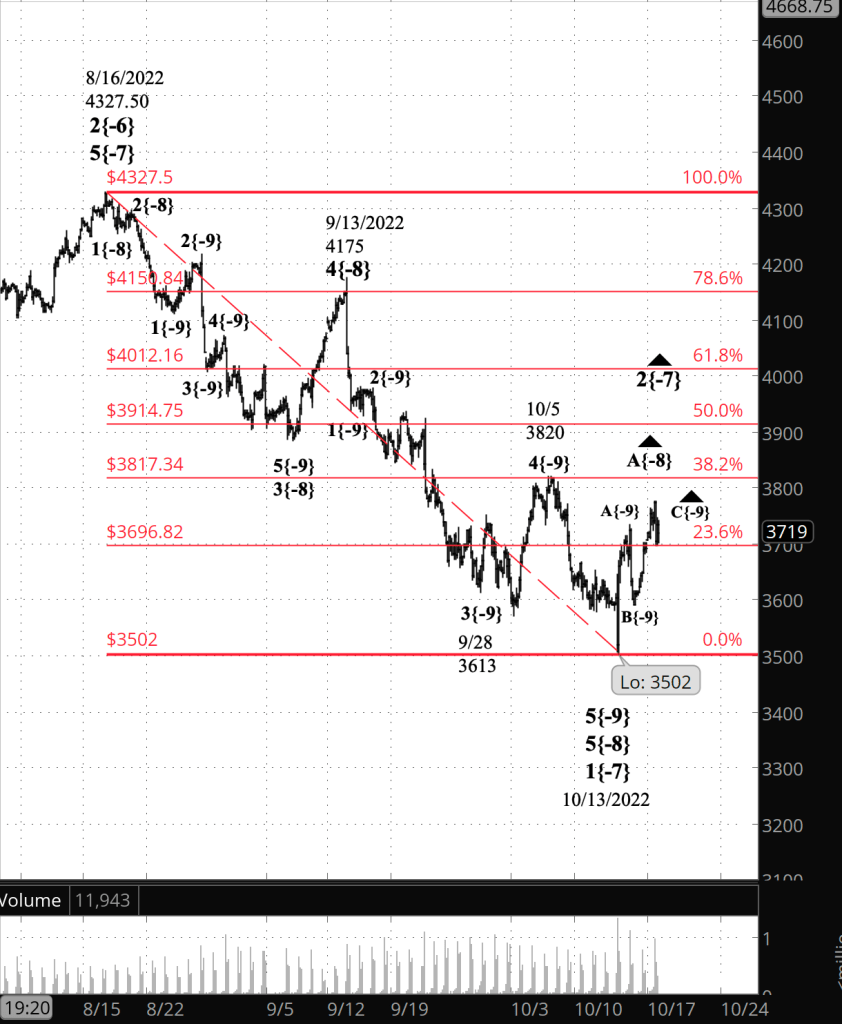
What does Elliott wave theory say? Wave 2{-7}, an upward correction, began on October, and is now in its first part, wave A{-8}. Within wave A{-8}, wave C{-9} is underway.
Under the principal analysis, wave 2{-7} is taking the form of a Zigzag, with five waves within its initial rise, wave A{-8}. Wave C{-9} will be followed by two more waves, D{-9} and E{-9}, to bring wave A{-8} to an end.
Under the alternative analysis, wave 2{-7} is taking the from of a Flat, with three waves internally. Wave C{-9} will bring wave A{-8} to close.
Under either scenario, wave A{-8} will be followed by a decline, wave B{-8}, and then a rise, wave C{-8}, which likely will bring wave 2{-7} to completion. That is, unless wave 2{-7} takes the form of a compound correction. In that case, the first corrective pattern will be followed by a second one and perhaps a third.
This is all happening within a downtrend, wave 3{-6}, which began on August 16 from 4327.50.
We Are Here.
These are the waves currently in progress under my principal analysis. Each line on the list shows the wave number, with the subscript in curly brackets, the traditional degree name, the starting date, the starting price of the S&P 500 E-mini futures, and the direction of the wave.
- S&P 500 Index:
- 5{+3} Supercycle, 7/8/1932, 4.40 (up)
- 5{+2} Cycle, 12/9/1974, 60.96 (up)
- 5{+1} Primary, 3/6/2009, 666.79 (up)
- 5{0} Intermediate, 12/26/2018, 2346.58 (up)
- 4{-1} Minor, 1/4/2022 4818.62 (down)
- 1{-2} Minute, 1/4/2022 4818.62 (down)
- S&P 500 Futures and index:
- 1{-3} Minuette, 1/4/2022, 4808.25 (down) (futures), 4818.62 (down) (index)
- S&P 500 Futures:
- 1{-4} Subminuette, 1/4/2022, 4808.25 (down)
- 1{-5} Micro, 1/4/2022, 4808.25 (down)
- 3{-6} Submicro, 8/16/2022, 4327.50 (down)
- 2{-7} Minuscule, 10/13/2022, 3502 (up)
- A{-8} Subminuscule, 10/13/2022, 3502 (up)
Learning and other resources. Elliott wave analysis provides context, not prophecy. As the 20th century semanticist Alfred Korzybski put it in his book Science and Sanity (1933), “The map is not the territory … The only usefulness of a map depends on similarity of structure between the empirical world and the map.” And I would add, in the ever-changing markets, we can judge that similarity of structure only after the fact.
See the menu page Analytical Methods for a rundown on where to go for information on Elliott wave analysis.
By Tim Bovee, Portland, Oregon, October 18, 2022
Disclaimer
Tim Bovee, Private Trader tracks the analysis and trades of a private trader for his own accounts. Nothing in this blog constitutes a recommendation to buy or sell stocks, options or any other financial instrument. The only purpose of this blog is to provide education and entertainment.
No trader is ever 100 percent successful in his or her trades. Trading in the stock and option markets is risky and uncertain. Each trader must make trading decisions for his or her own account, and take responsibility for the consequences.
License
All content on Tim Bovee, Private Trader by Timothy K. Bovee is licensed under a Creative Commons Attribution-ShareAlike 4.0 International License.
Based on a work at www.timbovee.com.

You must be logged in to post a comment.