3:30 p.m. New York time
Half an hour before the closing bell. The S&P 500 moved higher during the session, to 4017.50 on the futures. The move higher confirms this morning’s alternative analysis: Rising wave C{-9} within rising wave C{-8} is underway, within an upward correction, wave 2{-7}.
9:35 a.m. New York time
What’s happening now? The S&P 500 E-mini futures fell off slightly from Friday’s high, 4009.75, and remained within 30 points of that level.
What does it mean? The peak may have been the third of five waves within the rise that began on November 3 from 3704.25, and the pullback, the tentative first steps of the fourth wave. The fifth and final wave will most likely carry the price above Friday’s high and will complete the upward correction that began on October 13 from 3502. An energetic downtrend will follow.
What are the alternatives? The third wave within the rise that began on November 3 may still be underway, and the pullback is a small correction within that rising wave.
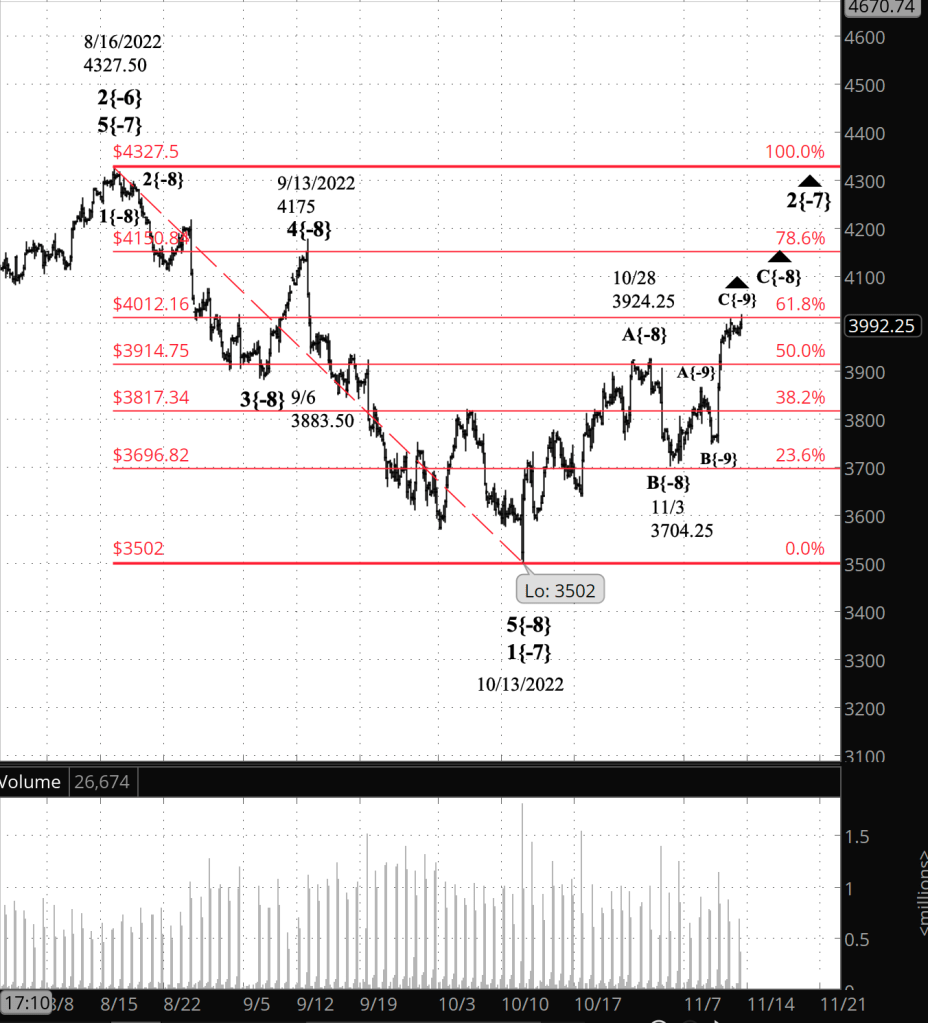
[S&P 500 E-mini futures at 3:30 p.m., 230-minute bars, with volume]
What does Elliott wave theory say? The rise that began on November 3 is wave C{-8}, the third wave within an upward correction, wave 2{-7}, that began on October 13.
Under the principal analysis, wave C{-9} — the middle wave within wave C{-8} — ended at Friday’s high, 4009.75, and declining wave D{-9} has begun. Under the alternative analysis, wave C{-9} is still underway.
At this point the two are of equal probability. Friday’s peak was at the 61.8% Fibonacci retracement level, which is often the endpoint of a corrective wave, and so I gave slightly more wait to the scenario that sees wave C{-9} as having ended at that level. If the price continues to fall, then the principal analysis matches the chart. If the price quickly rises back above 4009.75, then the alternative analysis matches the chart.
(The Fibonacci retracement levels are shown on the chart in red.)
In either case, wave C{-9} will be followed by a downward wave D{-9}, and then what will be the final wave of the corrective pattern, rising wave E{-9}, which will complete wave C{-8} and is also likely be the end of wave 2{-7}.
That last sentence has a hedge in it, regarding whether C{-8} will be the final wave within wave 2{-7}. Itr allows for the possibility that the upward correction, wave 2{-7}, will form a compound structure, linking two or three corrective patterns together. Compounding is not often seen in 2nd wave corrections, so I expect wave C{-8} to be the final wave within wave 2{-7}.
Wave 2{-7} will be followed by wave 3{-7}, a powerful downtrend that will carry the price below 3502 — the beginning of wave 2{-7} and perhaps significantly below that level.
Wave 3{-7} is a subwave of wave 1{-6}, a downtrend that began on August 16, and is the smallest of a series of downtrends of increasing size up to wave 4{-1}, which began on January 4 from 4818.62 on the index.
We Are Here.
These are the waves currently in progress under my principal analysis. Each line on the list shows the wave number, with the subscript in curly brackets, the traditional degree name, the starting date, the starting price of the S&P 500 E-mini futures, and the direction of the wave.
- S&P 500 Index:
- 5{+3} Supercycle, 7/8/1932, 4.40 (up)
- 5{+2} Cycle, 12/9/1974, 60.96 (up)
- 5{+1} Primary, 3/6/2009, 666.79 (up)
- 5{0} Intermediate, 12/26/2018, 2346.58 (up)
- 4{-1} Minor, 1/4/2022 4818.62 (down)
- 1{-2} Minute, 1/4/2022 4818.62 (down)
- S&P 500 Futures and index:
- 1{-3} Minuette, 1/4/2022, 4808.25 (down) (futures), 4818.62 (down) (index)
- S&P 500 Futures:
- 1{-4} Subminuette, 1/4/2022, 4808.25 (down)
- 1{-5} Micro, 1/4/2022, 4808.25 (down)
- 3{-6} Submicro, 8/16/2022, 4327.50 (down)
- 2{-7} Minuscule, 10/13/2022, 3502 (up)
- C{-8} Subminuscule, 11/3/2022, 3704.25 (up)
Learning and other resources. Elliott wave analysis provides context, not prophecy. As the 20th century semanticist Alfred Korzybski put it in his book Science and Sanity (1933), “The map is not the territory … The only usefulness of a map depends on similarity of structure between the empirical world and the map.” And I would add, in the ever-changing markets, we can judge that similarity of structure only after the fact.
See the menu page Analytical Methods for a rundown on where to go for information on Elliott wave analysis.
By Tim Bovee, Portland, Oregon, November 14, 2022
Disclaimer
Tim Bovee, Private Trader tracks the analysis and trades of a private trader for his own accounts. Nothing in this blog constitutes a recommendation to buy or sell stocks, options or any other financial instrument. The only purpose of this blog is to provide education and entertainment.
No trader is ever 100 percent successful in his or her trades. Trading in the stock and option markets is risky and uncertain. Each trader must make trading decisions for his or her own account, and take responsibility for the consequences.
License
All content on Tim Bovee, Private Trader by Timothy K. Bovee is licensed under a Creative Commons Attribution-ShareAlike 4.0 International License.
Based on a work at www.timbovee.com.

You must be logged in to post a comment.