3:30 p.m. New York time
Half an hour before the closing bell. During the session the S&P 500 futures declined from the overnight high, 4050.75, to 3960, and then rose slightly. The decline isn’t sufficient to conclude that the rise from November 3 has ended, so this morning’s analysis stands: The upward correction that began on October 13 is still underway. I’ve updated the chart.
9:35 a.m. New York time
What’s happening now? The S&P 500 E-mini futures reached 4050.75 in overnight trading, a new high in the rise that began on November 3 from 3704.25.
What does it mean? The rise is the final wave within the final wave of that rise that began on October 13 from 3502, an upward correction following the decline that began on August 16 from 4327.50. The correction has completed all of its requirements of form, as laid out in Elliott wave theory, and so any new high could mark the end of the correction and the beginning of a powerful downtrend that will carry the price below 3502, almost without a doubt significantly below that level.
I’ve marked the chart as though the correction were still underway. Such structures tend to end at Fibonacci retracement levels (although not always). The next higher Fib level is the 78.6% retracement, at 4150.84. (The Fibonacci levels are shown on the chart in red.)
What are the alternatives? However, the chances are about equal that the correction ended at the overnight high and that the subsequent small decline is the tentative beginning of what will turn out to be a powerful downtrend.
If the price rises above 4050.75, then the principal scenario matches the chart: The correction continues. The further the price continues to fall, the greater the likelihood that the alternative scenario matches the chart: The correction has ended.
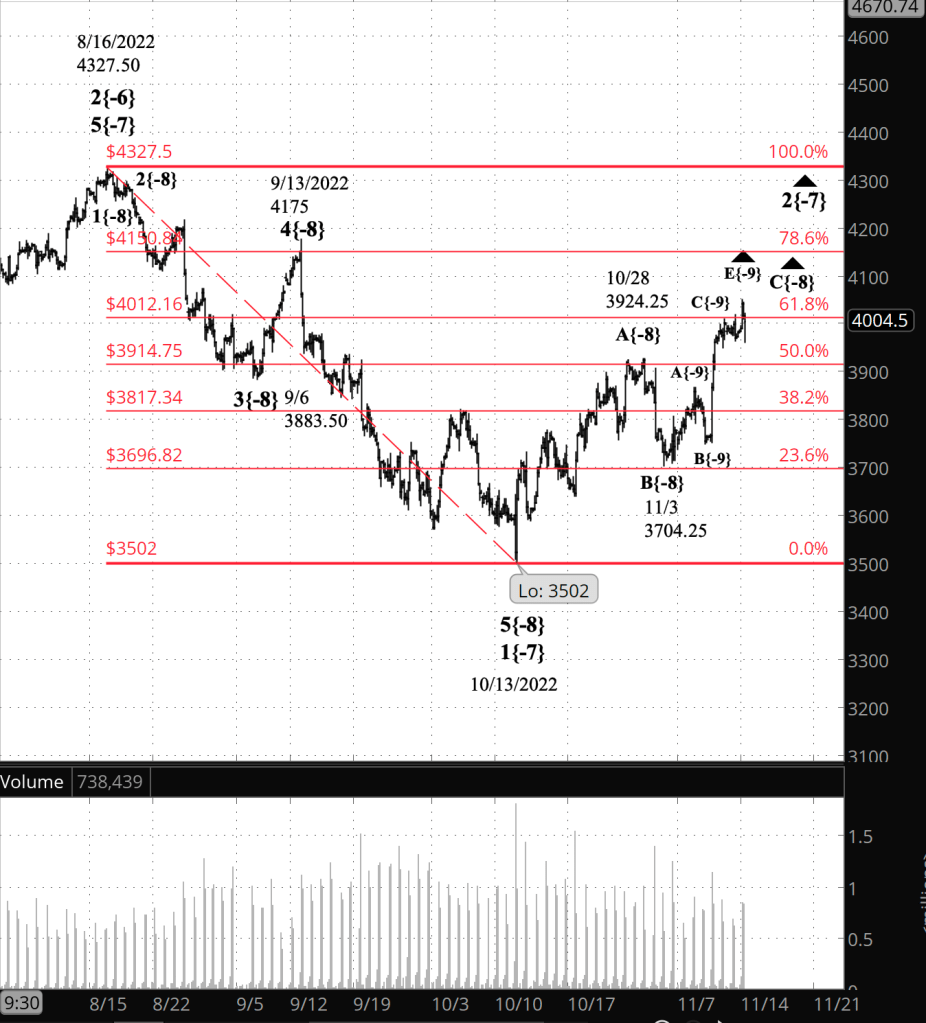
[S&P 500 E-mini futures at 3:30 p.m., 230-minute bars, with volume]
What does Elliott wave theory say? The upward correction is wave 2{-7}, which began on October 13. It is in its third segment, wave C{-8}, which in turn is in its final segment, wave E{-9}.
Under the alternative scenario, waves E{-9}, C{-8} and 2{-7} all ended at the overnight high, 4050.75.
The correction is a subwave of wave 3{-6}, a downtrend that began on August 16.
In either case, wave 2{-7} will be followed by wave 3{-7}, a powerful downtrend that will carry the precise below the start of wave 2{-7} — 3502 — and almost certainly significantly lower, into the 3400s or even the 3300s. Wave 3{-7} will be followed by another upward correction, wave 4{-7}, and then a final decline to new lows that will complete wave 3{-6}.
A larger upward correction, wave 4{-6}, will follow, and will be followed in turn by wave 5{-6}, a downtrend that will complete the parent, downtrending wave 1{-5}, which began on January 4 from 4808.25.
That starting point of wave 1{-5} is also the starting point of a nested series of increasingly larger 1st waves, stretching up to wave 1{-2}. It’s parent, wave 4{-1}, is the downtrending next-to-the-last wave within a large expanding Diagonal Triangle that began on December 26, 2018 from 2346.48 on the index.
There’s a lot of downside in that fractal stew, which will dominant the markets well into next year and possibly into 2024, seasoned by the occasional upward correction.
We Are Here.
These are the waves currently in progress under my principal analysis. Each line on the list shows the wave number, with the subscript in curly brackets, the traditional degree name, the starting date, the starting price of the S&P 500 E-mini futures, and the direction of the wave.
- S&P 500 Index:
- 5{+3} Supercycle, 7/8/1932, 4.40 (up)
- 5{+2} Cycle, 12/9/1974, 60.96 (up)
- 5{+1} Primary, 3/6/2009, 666.79 (up)
- 5{0} Intermediate, 12/26/2018, 2346.58 (up)
- 4{-1} Minor, 1/4/2022 4818.62 (down)
- 1{-2} Minute, 1/4/2022 4818.62 (down)
- S&P 500 Futures and index:
- 1{-3} Minuette, 1/4/2022, 4808.25 (down) (futures), 4818.62 (down) (index)
- S&P 500 Futures:
- 1{-4} Subminuette, 1/4/2022, 4808.25 (down)
- 1{-5} Micro, 1/4/2022, 4808.25 (down)
- 3{-6} Submicro, 8/16/2022, 4327.50 (down)
- 2{-7} Minuscule, 10/13/2022, 3502 (up)
- C{-8} Subminuscule, 11/3/2022, 3704.25 (up)
Learning and other resources. Elliott wave analysis provides context, not prophecy. As the 20th century semanticist Alfred Korzybski put it in his book Science and Sanity (1933), “The map is not the territory … The only usefulness of a map depends on similarity of structure between the empirical world and the map.” And I would add, in the ever-changing markets, we can judge that similarity of structure only after the fact.
See the menu page Analytical Methods for a rundown on where to go for information on Elliott wave analysis.
By Tim Bovee, Portland, Oregon, November 15, 2022
Disclaimer
Tim Bovee, Private Trader tracks the analysis and trades of a private trader for his own accounts. Nothing in this blog constitutes a recommendation to buy or sell stocks, options or any other financial instrument. The only purpose of this blog is to provide education and entertainment.
No trader is ever 100 percent successful in his or her trades. Trading in the stock and option markets is risky and uncertain. Each trader must make trading decisions for his or her own account, and take responsibility for the consequences.
License
All content on Tim Bovee, Private Trader by Timothy K. Bovee is licensed under a Creative Commons Attribution-ShareAlike 4.0 International License.
Based on a work at www.timbovee.com.

You must be logged in to post a comment.