9:35 a.m. New York time
What’s happening now? The S&P 500 E-mini futures continued to rise overnight, reaching 4049.25 and then declining back into the 4030s. U.S. markets are closed today for a holiday, Thanksgiving Day, and so there will be no opening bell.
What does it mean? The correction that began on October 13 is still underway. The overnight high reversed 1-1/2 points below the correction peak so far, 4050.75, attained on November 15. Internally, the correction is in its rising third and last leg, and that rise is in the declining fourth subwave in a five-wave series.
What is the alternative? The November 17 low, 4039.50, was the end the fourth subwave and the rising fifth subwave is underway. When it is complete, it will mark the end of the third leg of the correction and most likely the end of the correction itself.
If the price moves above 4050.75, the prior correction peak, then I shall reanalyze the chart to see if the alternative scenario should be promoted to the principal scenario.
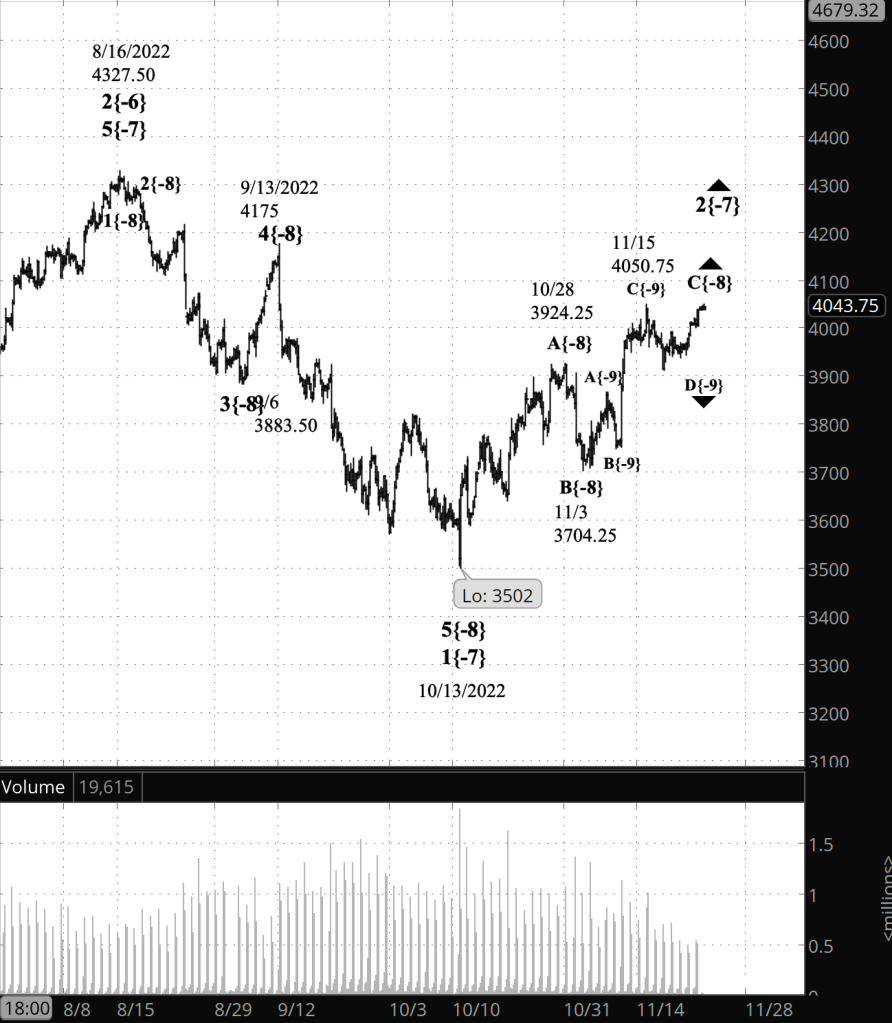
[S&P 500 E-mini futures at 9:35 a.m., 4-hour bars, with volume]
What does Elliott wave theory say? The correction is wave 2{-7}. It is in its 3rd leg, wave C{-8}.
Under the principal analysis, wave C{-8} is in its fourth subwave, wave D{-9}. The alternative analysis sees wave D{-9} as having ended and labels the rise since November 17 as wave E{-9}.
We Are Here.
These are the waves currently in progress under my principal analysis. Each line on the list shows the wave number, with the subscript in curly brackets, the traditional degree name, the starting date, the starting price of the S&P 500 E-mini futures, and the direction of the wave.
- S&P 500 Index:
- 5{+3} Supercycle, 7/8/1932, 4.40 (up)
- 5{+2} Cycle, 12/9/1974, 60.96 (up)
- 5{+1} Primary, 3/6/2009, 666.79 (up)
- 5{0} Intermediate, 12/26/2018, 2346.58 (up)
- 4{-1} Minor, 1/4/2022 4818.62 (down)
- 1{-2} Minute, 1/4/2022 4818.62 (down)
- S&P 500 Futures and index:
- 1{-3} Minuette, 1/4/2022, 4808.25 (down) (futures), 4818.62 (down) (index)
- S&P 500 Futures:
- 1{-4} Subminuette, 1/4/2022, 4808.25 (down)
- 1{-5} Micro, 1/4/2022, 4808.25 (down)
- 3{-6} Submicro, 8/16/2022, 4327.50 (down)
- 2{-7} Minuscule, 10/13/2022, 3502 (up)
- C{-8} Subminuscule, 11/3/2022, 3704.25 (up)
Learning and other resources. Elliott wave analysis provides context, not prophecy. As the 20th century semanticist Alfred Korzybski put it in his book Science and Sanity (1933), “The map is not the territory … The only usefulness of a map depends on similarity of structure between the empirical world and the map.” And I would add, in the ever-changing markets, we can judge that similarity of structure only after the fact.
See the menu page Analytical Methods for a rundown on where to go for information on Elliott wave analysis.
By Tim Bovee, Portland, Oregon, November 24, 2022
Disclaimer
Tim Bovee, Private Trader tracks the analysis and trades of a private trader for his own accounts. Nothing in this blog constitutes a recommendation to buy or sell stocks, options or any other financial instrument. The only purpose of this blog is to provide education and entertainment.
No trader is ever 100 percent successful in his or her trades. Trading in the stock and option markets is risky and uncertain. Each trader must make trading decisions for his or her own account, and take responsibility for the consequences.
License
All content on Tim Bovee, Private Trader by Timothy K. Bovee is licensed under a Creative Commons Attribution-ShareAlike 4.0 International License.
Based on a work at www.timbovee.com.

You must be logged in to post a comment.