12:30 p.m. New York time
Half an hour before the closing bell. The S&P 500 continued to work its way lower during the session, to 4024.75 on the futures at the lowest point so far today. No change in the analysis. I’ve updated the upper chart.
9:35 a.m. New York time
An early closing bell. The U.S. markets will close early today, at 1 p.m., as is customary on the day following the Thanksgiving Day holiday. Regular session hours, 9:30 a.m. to 3:30 p.m., will resume on Monday. The S&P 500 futures trade both during the session and outside of regular hours.
What’s happening now? The S&P 500 E-mini futures declined in overnight trading, reaching into the 4030s as the opening bell approached. The price remained below the high so far, 4049.25, reached on November 15 by the upward correction that began on October 13.
What does it mean? The correction is in its final phase — the rising third wave — and within that structure, is in a declining wave, the fourth wave in a series of five. I expect the rising fifth wave, which will likely complete the correction, to rise above the 4049.25 high. The correction, when complete, will be followed by a powerful downtrend.
What are the alternative? The 4049.25 peak was the end of the fifth wave, of the final phase of the upward correction, and possibly of the correction as a whole.
Corollary #1: The decline after the peak is the first tentative step in a powerful downtrend that will cary the price below 3502, the starting point of the upward correction, and most likely significantly below that level.
Corollary #2: The upward correction is taking a compound form, containing two or three corrective patterns. In that case, the decline following the peak connects the first corrective pattern, with a second corrective pattern that still lies in future. When the compound correction is over, the powerful downtrend will begin.
The charts. The upper chart shows the S&P 500 futures from July of this year to the present. The lower chart shows the S&P 500 index from November 2017 to the present.
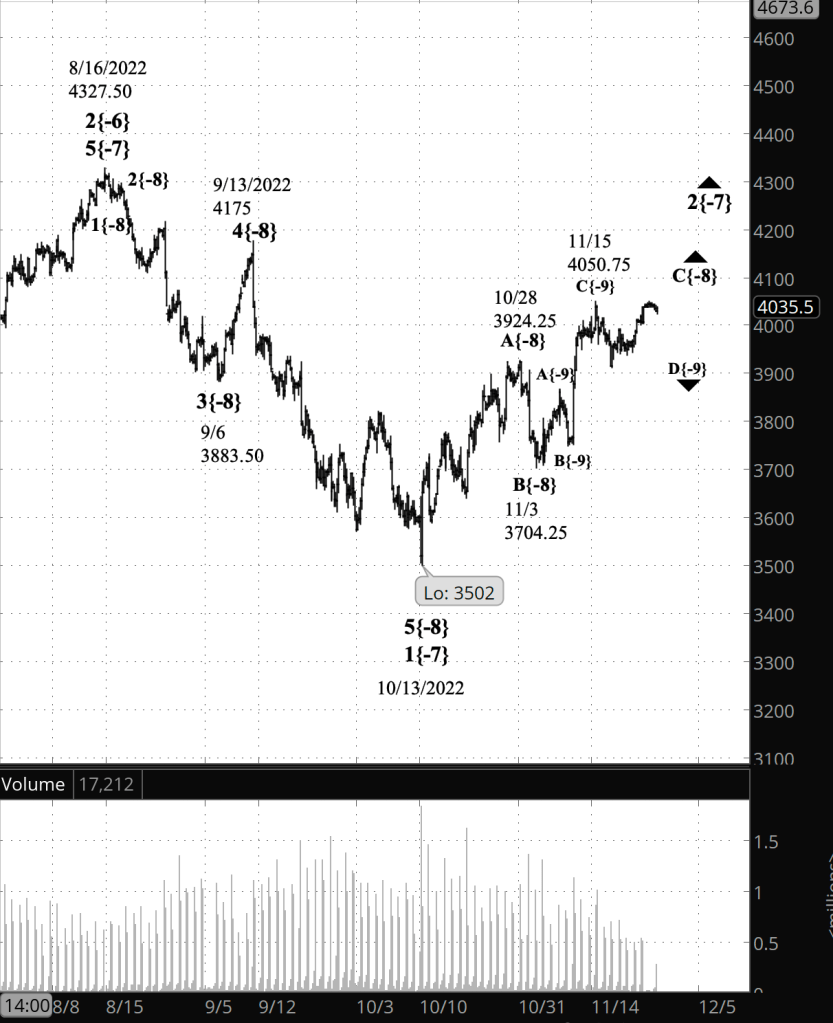
[S&P 500 E-mini futures at 9:35 a.m., 4-hour bars, with volume]
What does Elliott wave theory say? The upward correction that began on October 13 is wave 2{-7}.
Under the principal analysis, the correction is in wave 3{-8}, its final phase, and within wave 3{-8}, is in wave D{-9}, a declining wave that will be followed by rising wave E{-9}, the final wave of the corrective pattern and most likely of the wave 2{-7} correction itself. I expect wave E{-9} to exceed the 4049.25 peak, which is the end of rising wave C{-9}, the middle subwave of wave C{-8}.
The powerful downtrend that follows the correction will be wave 3{-7}, the middle wave of a larger downtrend, wave 3{-6}, which began on August 16.
Under the alternative analysis, the 4049.25 peak was the end of wave E{-9} and therefore of wave C{-8}. This see this as being less likely. Wave C{-8} must have five waves internally, since the correction has taken the form of a Zigzag. Although there is a shallow decline that could count as a fourth internal wave, it doesn’t seem deep enough to fulfill that roll. So as the principal analysis I am counting the 4049.25 peak as the wave C{-9} endpoint and placing the wave E{-9} endpoint as an alternative.
The two corollaries have to do with the nature of the decline that follows the 4049.25 peak. Corollary #1 sees it as the beginning of wave 3{-7}, a powerful downtrend. Corollary #2 sees it as a wave connecting two corrective patterns within the ongoing wave 2{-7} upward correction. The present decline is wave X{-8}, and it will be followed by a second corrective pattern, beginning with rising wave A{-8}.
In 2nd waves, simple corrections are far more common than compound corrections, which are mainly found in 4th wave corrections.
The parent wave of all of this, wave 3{-6}, lies within a series of increasingly larger 1st-wave downtrends, stretching from wave 1{-5} to wave 1{-2}. They all began on January 4 from 4818.62 on the index. They are all part of wave 4{-1}, the next-to-the-last wave within wave 5{0}, an expanding Diagonal Triangle that began on December 26, 2018.
Wave 4{-1} is a major decline that could carry the price into the 2500s and perhaps even below 2000. It will be followed by the final wave of the Triangle, wave 5{0}, an uptrending wave that will carry the price above the January 4 peak, 4818.62 on the index, into the mid-5600s and perhaps even higher.
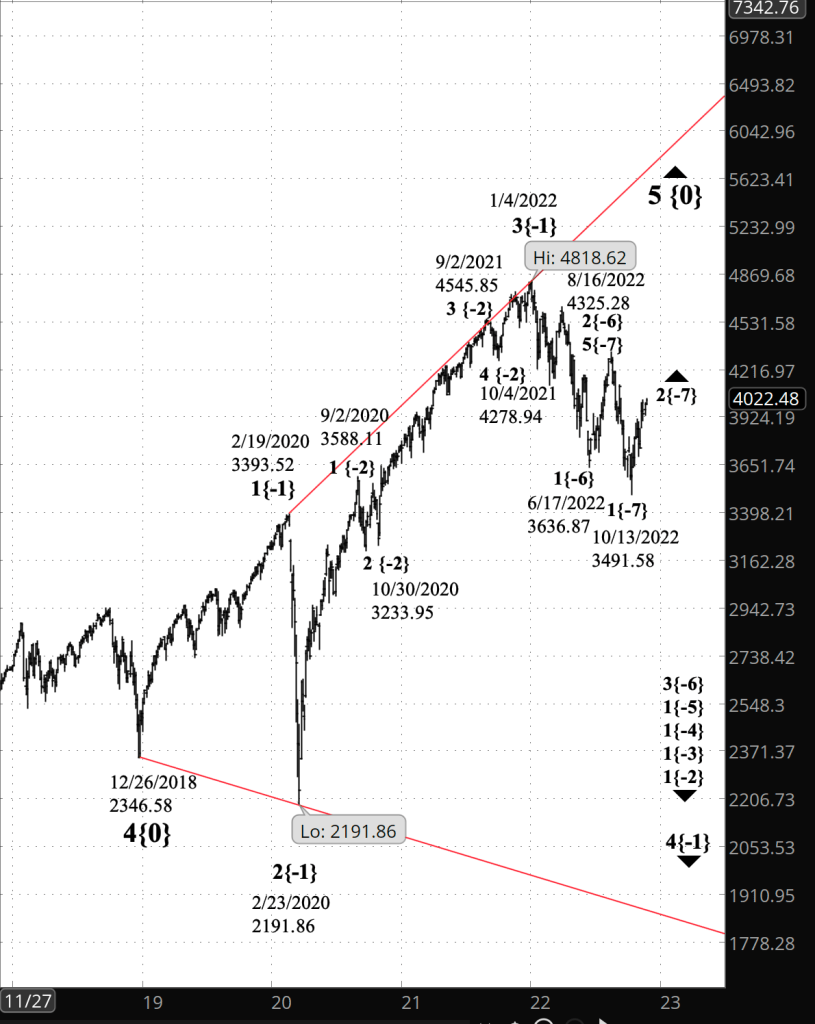
[S&P 500 index at 9:35 a.m., 3-day bars]
We Are Here.
These are the waves currently in progress under my principal analysis. Each line on the list shows the wave number, with the subscript in curly brackets, the traditional degree name, the starting date, the starting price of the S&P 500 E-mini futures, and the direction of the wave.
- S&P 500 Index:
- 5{+3} Supercycle, 7/8/1932, 4.40 (up)
- 5{+2} Cycle, 12/9/1974, 60.96 (up)
- 5{+1} Primary, 3/6/2009, 666.79 (up)
- 5{0} Intermediate, 12/26/2018, 2346.58 (up)
- 4{-1} Minor, 1/4/2022 4818.62 (down)
- 1{-2} Minute, 1/4/2022 4818.62 (down)
- S&P 500 Futures and index:
- 1{-3} Minuette, 1/4/2022, 4808.25 (down) (futures), 4818.62 (down) (index)
- S&P 500 Futures:
- 1{-4} Subminuette, 1/4/2022, 4808.25 (down)
- 1{-5} Micro, 1/4/2022, 4808.25 (down)
- 3{-6} Submicro, 8/16/2022, 4327.50 (down)
- 2{-7} Minuscule, 10/13/2022, 3502 (up)
- C{-8} Subminuscule, 11/3/2022, 3704.25 (up)
Learning and other resources. Elliott wave analysis provides context, not prophecy. As the 20th century semanticist Alfred Korzybski put it in his book Science and Sanity (1933), “The map is not the territory … The only usefulness of a map depends on similarity of structure between the empirical world and the map.” And I would add, in the ever-changing markets, we can judge that similarity of structure only after the fact.
See the menu page Analytical Methods for a rundown on where to go for information on Elliott wave analysis.
By Tim Bovee, Portland, Oregon, November 25, 2022
Disclaimer
Tim Bovee, Private Trader tracks the analysis and trades of a private trader for his own accounts. Nothing in this blog constitutes a recommendation to buy or sell stocks, options or any other financial instrument. The only purpose of this blog is to provide education and entertainment.
No trader is ever 100 percent successful in his or her trades. Trading in the stock and option markets is risky and uncertain. Each trader must make trading decisions for his or her own account, and take responsibility for the consequences.
License
All content on Tim Bovee, Private Trader by Timothy K. Bovee is licensed under a Creative Commons Attribution-ShareAlike 4.0 International License.
Based on a work at www.timbovee.com.

You must be logged in to post a comment.