3:30 p.m. New York time
Half an hour before the closing bell. The S&P 500 futures spent much of the session in the 3960s and 3970s, in a relatively small upward correction within a larger downtrend. No change in the analysis. I’ve updated the chart.
9:35 a.m. New York time
What’s happening now? The S&P 500 E-mini futures fell sharply an hour before the opening bell, coinciding with the release of Producer Price Index, which came in higher than the consensus had anticipated.
What does it mean? The decline, from the 3990s to the 3930s, began the 5th and final portion within the 1st part of a downtrend that began on December 1 from 4110. The 1st wave within the trend will be followed by an upward correction, and then by a more powerful decline.
What are the alternatives? The two alternatives listed since the downtrend began continue to be possibilities. The lower the price goes, the less likely they become.
Alternative #1: The upward correction that began on October 13 is still underway.
Alternative #2: The upward correction is forming a compound structure, containing two or three corrective patterns. The first corrective pattern ended on December 1, and the decline that followed is a connector that will be followed by a second corrective pattern.
Alternative #3: The 4th portion of the 1st part of the downtrend may still be underway.
Chart notes. The chart’s directional movements, called “waves” in Elliott wave analysis, are consistent with a trend, called an “impulse wave”. An impulse wave has five subwaves, and each subwave in turn contains its own smaller waves.
The trick early in a trend is deciding how the waves on the chart relate to the larger trending wave. The waves within the trend are numbered, and I designate their relative size — their “degree” in Elliott’s terminology — by a subscript shown within curly brackets.
Here’s how the subscripts are distributed on the chart.
- The trend itself is degree {-7}.
- The first wave within the trend is degree {-8}.
- Those still smaller waves are… hard to say. I’ve labeled them as {-9} because that seems roughly consistent in time taken with the initial stage of an earlier 1st wave. But they could be a degree smaller, {-10}. Or even a degree larger, {-8}.
The problem will work itself out as the trend develops. Meanwhile, the degrees are a guess and might well change.
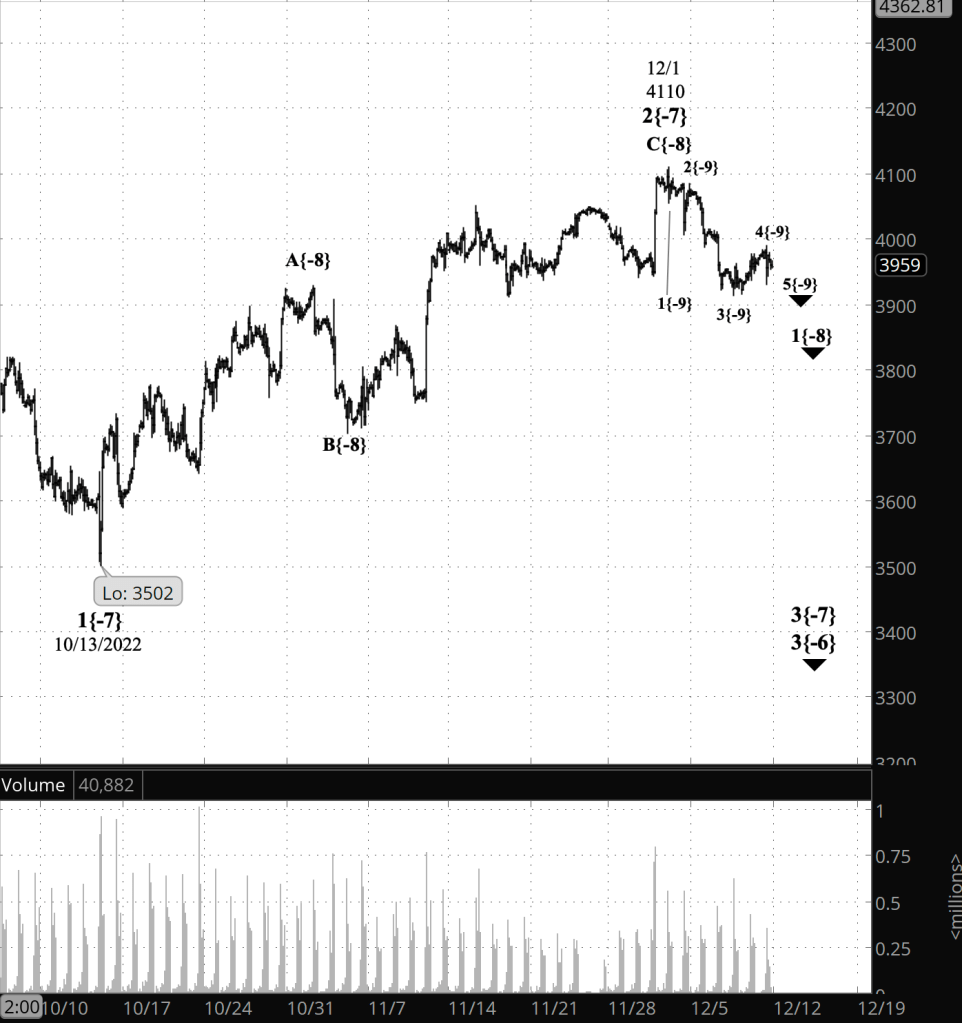
[S&P 500 E-mini futures at 3:30 p.m., 2-hour bars, with volume]
What does Elliott wave theory say? These are waves that I’m tracking at this moment.
- The downtrend that began on December 1 is wave 3{-7}. It’s a 3rd wave, so the force is strong in this one.
- The 1st subwave within the downtrend is wave 1{-8}.
- Wave 1{-8} will have five subwaves internally and is in its 5th and final subwave, numbered 5{-9}.
Wave 5{-9}, when complete, will also be the end of wave 1{-8}, which will be followed by an upward correction, wave 2{-8}, and then by further decline, wave 3{-8}
Wave 3{-7} will be completed by the end of its final wave, 5{-8}, and will be followed by an upward correction, wave 4[-7}. After the correction, the downtrend will resume as wave 5{-7}, carrying the price still lower.
Alternative waves. Here are the significant waves within the three alternatives.
Alternative #1: Wave 2{-7} is still underway and has not yet completed its first corrective pattern.
Alternative #2: Wave 2{-7} has completed its first corrective pattern. The present decline is wave X{-8}, connecting the first corrective pattern to a second one within a compound correction.
Alternative #3: Wave 4{-9} within wave 1{-8} within the downtrend, wave 3{-7}, are underway.
We Are Here.
These are the waves currently in progress under my principal analysis. Each line on the list shows the wave number, with the subscript in curly brackets, the traditional degree name, the starting date, the starting price of the S&P 500 E-mini futures, and the direction of the wave.
- S&P 500 Index:
- 5{+3} Supercycle, 7/8/1932, 4.40 (up)
- 5{+2} Cycle, 12/9/1974, 60.96 (up)
- 5{+1} Primary, 3/6/2009, 666.79 (up)
- 5{0} Intermediate, 12/26/2018, 2346.58 (up)
- 4{-1} Minor, 1/4/2022 4818.62 (down)
- 1{-2} Minute, 1/4/2022 4818.62 (down)
- S&P 500 Futures and index:
- 1{-3} Minuette, 1/4/2022, 4808.25 (down) (futures), 4818.62 (down) (index)
- S&P 500 Futures:
- 1{-4} Subminuette, 1/4/2022, 4808.25 (down)
- 1{-5} Micro, 1/4/2022, 4808.25 (down)
- 3{-6} Submicro, 8/16/2022, 4327.50 (down)
- 3{-7} Minuscule, 12/1/2022, 4110 (down)
- 1{-8} Subminuscule, 12/1/2022, 4110 (down)
Learning and other resources. Elliott wave analysis provides context, not prophecy. As the 20th century semanticist Alfred Korzybski put it in his book Science and Sanity (1933), “The map is not the territory … The only usefulness of a map depends on similarity of structure between the empirical world and the map.” And I would add, in the ever-changing markets, we can judge that similarity of structure only after the fact.
See the menu page Analytical Methods for a rundown on where to go for information on Elliott wave analysis.
By Tim Bovee, Portland, Oregon, December 9, 2022
Disclaimer
Tim Bovee, Private Trader tracks the analysis and trades of a private trader for his own accounts. Nothing in this blog constitutes a recommendation to buy or sell stocks, options or any other financial instrument. The only purpose of this blog is to provide education and entertainment.
No trader is ever 100 percent successful in his or her trades. Trading in the stock and option markets is risky and uncertain. Each trader must make trading decisions for his or her own account, and take responsibility for the consequences.
License
All content on Tim Bovee, Private Trader by Timothy K. Bovee is licensed under a Creative Commons Attribution-ShareAlike 4.0 International License.
Based on a work at www.timbovee.com.

You must be logged in to post a comment.