3:30 p.m. New York time
Half an hour before the closing bell. The S&P 500 futures rose above Friday’s high of 3990, replacing this morning’s principal analysis with the first alternative analysis: The rising next-to-the-last wave within the first leg of a downtrend that began on December 1 is still underway. In Elliott wave terminology, wave 4{-9} within wave 1{-8} within wave 3{-7} is in progress. I’ve updated the chart.
9:35 a.m. New York time
What’s happening now? The S&P 500 E-mini futures fell to the 3950s in overnight trading and then rose back into the 3980s.
What does it mean? The final decline within the 1st leg of a downtrend that began on December 1 is underway.
What are the alternatives? There are several.
- Alternative #1: The final decline within the downtrend’s first leg has not yet begun.
- Alternative #2: The downtrend itself has not yet begun. Instead, the upward correction that preceded it is forming a compound structure, and the decline from December 1 will connect the now complete first corrective pattern with a second corrective pattern that has not yet begun.
- Alternative #3: The first corrective pattern within the upward correction is still underway.
All three alternatives are based on the fact that the downtrend that began on December 1 hasn’t fallen very far yet — from 4110 to 3914 at the low point since December 1. This creates ambiguity in determining what the pattern on the chart is.
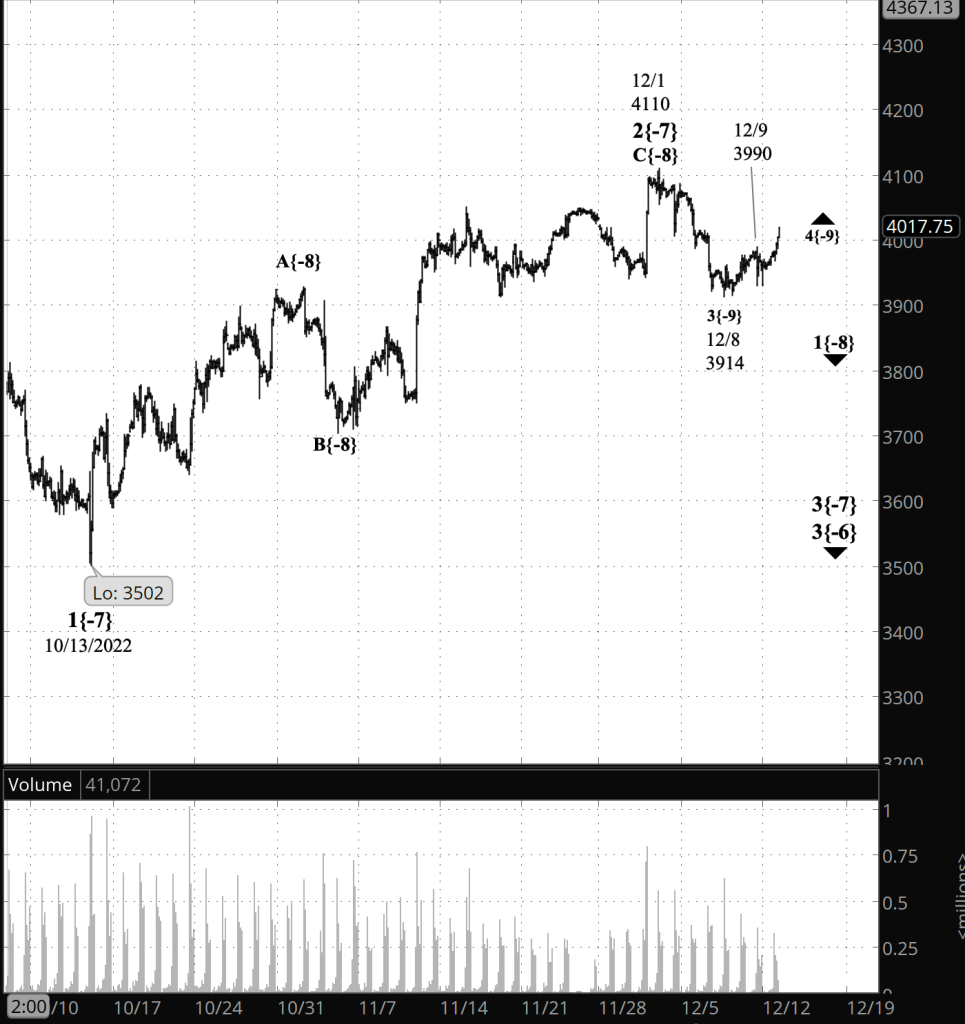
[S&P 500 E-mini futures at 3:30 p.m., 2-hour bars, with volume]
What does Elliott wave theory say? Under R.N. Elliott’s theory of stock chart patterns, each directional movement is called a wave, each wave contains subwaves and is in turn a subwave of a larger wave. And all waves follow the same set of patterns.
A wave in the direction of the trend is an impulse wave and has five numbered subwaves. A wave moving opposite of the trend is a corrective wave and usually has three subwaves designated by letters. Each wave label contains a subscript, in curly brackets, that show its relative size compare to other waves, which Elliott called its “degree”.
These are the waves that are key to today’s analysis.
- The downtrend that began on December 1 from 4110 is wave 3{-7}.
- Internally, wave 3{-7} is in its first leg, wave 1{-8}
- Wave 1{-8} in turn is in its final leg, wave 5{-9}.
- Wave 3{-7} follows an upward correction, wave 2{-7}, which ended on December 1.
- If wave 2{-7} is forming a compound correction, then the first corrective pattern ended on December 1 with wave C{-8}, the present decline is a connector, wave X{-8}, and the second corrective pattern will begin afterward with wave A{-8}.
- All of this is happening within wave 3{-6}, which began on August 16 from 4327.50
- Wave 3{-6} is a subwave of wave 1{-5}, which began on January 4 from 4808.25, the start of the rise that began on February 23, ending the crash at the start of the COVID-19 pandemic.
Since the decline from the January 4 peak is only in its first of five subwaves, the chart shows that there is much downside ahead before the present downtrend is complete.
We Are Here.
These are the waves currently in progress under my principal analysis. Each line on the list shows the wave number, with the subscript in curly brackets, the traditional degree name, the starting date, the starting price of the S&P 500 E-mini futures, and the direction of the wave.
- S&P 500 Index:
- 5{+3} Supercycle, 7/8/1932, 4.40 (up)
- 5{+2} Cycle, 12/9/1974, 60.96 (up)
- 5{+1} Primary, 3/6/2009, 666.79 (up)
- 5{0} Intermediate, 12/26/2018, 2346.58 (up)
- 4{-1} Minor, 1/4/2022 4818.62 (down)
- 1{-2} Minute, 1/4/2022 4818.62 (down)
- S&P 500 Futures and index:
- 1{-3} Minuette, 1/4/2022, 4808.25 (down) (futures), 4818.62 (down) (index)
- S&P 500 Futures:
- 1{-4} Subminuette, 1/4/2022, 4808.25 (down)
- 1{-5} Micro, 1/4/2022, 4808.25 (down)
- 3{-6} Submicro, 8/16/2022, 4327.50 (down)
- 3{-7} Minuscule, 12/1/2022, 4110 (down)
- 1{-8} Subminuscule, 12/1/2022, 4110 (down)
Learning and other resources. Elliott wave analysis provides context, not prophecy. As the 20th century semanticist Alfred Korzybski put it in his book Science and Sanity (1933), “The map is not the territory … The only usefulness of a map depends on similarity of structure between the empirical world and the map.” And I would add, in the ever-changing markets, we can judge that similarity of structure only after the fact.
See the menu page Analytical Methods for a rundown on where to go for information on Elliott wave analysis.
By Tim Bovee, Portland, Oregon, December 12, 2022
Disclaimer
Tim Bovee, Private Trader tracks the analysis and trades of a private trader for his own accounts. Nothing in this blog constitutes a recommendation to buy or sell stocks, options or any other financial instrument. The only purpose of this blog is to provide education and entertainment.
No trader is ever 100 percent successful in his or her trades. Trading in the stock and option markets is risky and uncertain. Each trader must make trading decisions for his or her own account, and take responsibility for the consequences.
License
All content on Tim Bovee, Private Trader by Timothy K. Bovee is licensed under a Creative Commons Attribution-ShareAlike 4.0 International License.
Based on a work at www.timbovee.com.

You must be logged in to post a comment.