3:30 p.m. New York time
Half an hour before the closing bell. The S&P 500 futures reached a low for the day of 3871.25 during the the morning and then rose slightly, remaining below the Monday evening high, 3900.50. No change in this morning’s analysis. I’ve updated the near-term (upper) chart.
9:35 a.m. New York time
What’s happening now? The S&P 500 E-mini futures rose when trading resumed Monday evening, reaching 3900.50 and then pulling back to the 3840s.
What does it mean? The price stayed below the starting point of the downtrend that began on December 21 from 3919.75. The pattern is consistent with a small upward correction that has reached completion, followed by a small downtrend that is now underway. These low-level moves are happening within the third leg of the first leg of a larger downtrend that began on December 13 from 4180.
What are the alternatives? The same two that has been with us since mid-December:
- Alternative #1: The larger upward correction that began on October 13 is is still underway and is in its final segment.
- Alternative #2: The upward correction that began on October 13 is still underway and is taking the from of a compound correction, containing two or three corrective patterns. The first corrective pattern ended on December 13, and the decline that followed will link the first corrective pattern to the second one.
As the price continues to move lower, both of the alternatives continue to lose credibility.
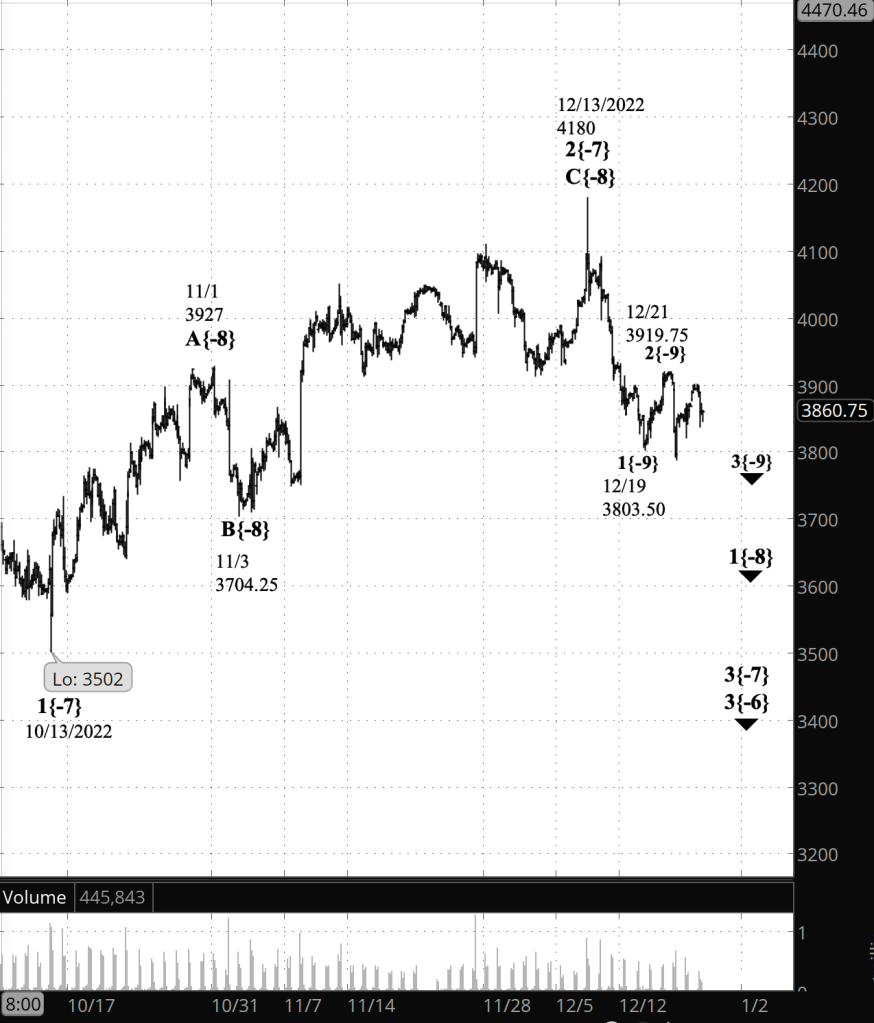
[S&P 500 E-mini futures at 3:30 p.m., 150-minute bars, with volume]
What does Elliott wave theory say? These are the waves I’m following closely at this point.
Under the principal analysis,
- The small upward correction that ended overnight was wave 2{-10}.
- The downtrend that followed is wave 3{-10}.
- Both are happening within downtrending wave 3{-9}, which began on December 21.
- Moving up one degree, downtrending wave 1{-8} contains all of the smaller waves described above.
- Wave 1{-8} is a subwave of wave 3{-7}, which began on December 13.
Under the alternative analyses,
- Alternative #1: Wave 2{-7} is still underway and is its final subwave, wave C{-8}.
- Alternative #2: Wave 2{-7}, a compound correction, has completed wave C{-8}, the final wave of its first corrective pattern. The decline from December 13 is wave X{-8}, connecting the completed wave C{-8} to the first wave, A{-8}, of its second corrective pattern.
Bigger picture. Wave 3{-7} is a downtrend, and as is the case with all 3rd waves, it will be a powerful decline. That power is enhanced because wave 3{-7}’s parent wave is wave 3{-6}, which began on August 16. So we are presently seeing a triple 3rd: Three wave 3s nested within one another.
Wave 3{-6} is in turn a subwave of a series of 1st waves reaching up four degrees to wave 1{-2}, which began on January 4.
The 1st waves are subwaves of declining wave 4{-1} the next to the last wave within an expanding Diagonal Triangle, wave 5{0}, which began on December 26, 2018, from 2346.58.
The nature of an expanding Triangle is that the subsequent highs and lows are higher and lower than the extremes that came before. So I’m looking for a slow-motion roller-coaster ride as wave 4{-1} sinks to a new low within the Triangle and then wave 5{-1} rises to a new high.
The boundaries of the Diagonal Triangle are shown in red on the chart below.
[S&P 500 index at 9:25 a.m., 3-day bars]
We Are Here.
These are the waves currently in progress under my principal analysis. Each line on the list shows the wave number, with the subscript in curly brackets, the traditional degree name, the starting date, the starting price of the S&P 500 E-mini futures, and the direction of the wave.
- S&P 500 Index:
- 5{+3} Supercycle, 7/8/1932, 4.40 (up)
- 5{+2} Cycle, 12/9/1974, 60.96 (up)
- 5{+1} Primary, 3/6/2009, 666.79 (up)
- 5{0} Intermediate, 12/26/2018, 2346.58 (up)
- 4{-1} Minor, 1/4/2022 4818.62 (down)
- 1{-2} Minute, 1/4/2022 4818.62 (down)
- S&P 500 Futures and index:
- 1{-3} Minuette, 1/4/2022, 4808.25 (down) (futures), 4818.62 (down) (index)
- S&P 500 Futures:
- 1{-4} Subminuette, 1/4/2022, 4808.25 (down)
- 1{-5} Micro, 1/4/2022, 4808.25 (down)
- 3{-6} Submicro, 8/16/2022, 4327.50 (down)
- 3{-7} Minuscule, 12/1/2022, 4110 (down)
- 1{-8} Subminuscule, 12/1/2022, 4110 (down)
Learning and other resources. Elliott wave analysis provides context, not prophecy. As the 20th century semanticist Alfred Korzybski put it in his book Science and Sanity (1933), “The map is not the territory … The only usefulness of a map depends on similarity of structure between the empirical world and the map.” And I would add, in the ever-changing markets, we can judge that similarity of structure only after the fact.
See the menu page Analytical Methods for a rundown on where to go for information on Elliott wave analysis.
By Tim Bovee, Portland, Oregon, December 27, 2022
Disclaimer
Tim Bovee, Private Trader tracks the analysis and trades of a private trader for his own accounts. Nothing in this blog constitutes a recommendation to buy or sell stocks, options or any other financial instrument. The only purpose of this blog is to provide education and entertainment.
No trader is ever 100 percent successful in his or her trades. Trading in the stock and option markets is risky and uncertain. Each trader must make trading decisions for his or her own account, and take responsibility for the consequences.
License
All content on Tim Bovee, Private Trader by Timothy K. Bovee is licensed under a Creative Commons Attribution-ShareAlike 4.0 International License.
Based on a work at www.timbovee.com.

You must be logged in to post a comment.