3:30 p.m. New York time
Half an hour before the closing bell. The S&P 500 futures has continued to fall during the session, so far reaching the 3808.25. The pattern is consistent with this morning’s Triple-3 analysis: A smaller downtrend, wave 3{-9}, within a larger downtrend, wave 3{-8}, within a still larger downtrend, wave 3{-7}, are all under way.
I’ve updated the chart.
1:25 p.m. New York time
SPY options trade exit. I’ve exited my short bear call options spread on SPY for half of maximum potential profit and have updated the trade analysis with full results.
9:35 a.m. New York time
What’s happening now? The S&P 500 E-mini futures traded in a narrow range overnight, remaining largely in the 3850s, with occasional forays higher and lower.
What does it mean? The downtrend that began on December 13 continues and is in its first leg. In turn, that middle segment, which likely will carry the price into the 3600s or below, has completed a small upward correction and is also in its middle segment.
What are the alternatives? There are three.
Looking first at the larger downtrend,
- Alternative #1: The larger upward correction that began on October 13 is is still underway and is in its final segment. A fall below 3502, the correction’s starting point, would disprove this scenario.
- Alternative #2: The upward correction that began on October 13 is still underway and is taking the from of a compound correction, containing two or three corrective patterns. The first corrective pattern ended on December 13, and the decline that followed will link the first corrective pattern to the second one. A decline below 3704.25, the starting point of the third leg of the correction, would make this scenario less likely.
A rise above 4180, the endpoint of larger upward correction under the principal analysis, would confirm either of these alternatives.
Looking at the smaller downtrend that is part of the larger one,
- Alternative #3: The upward correction that began on December 19 may still be underway and is in its third segment.
A fall below 3803.50, the December 19 starting point, would come close to disproving this alternative.
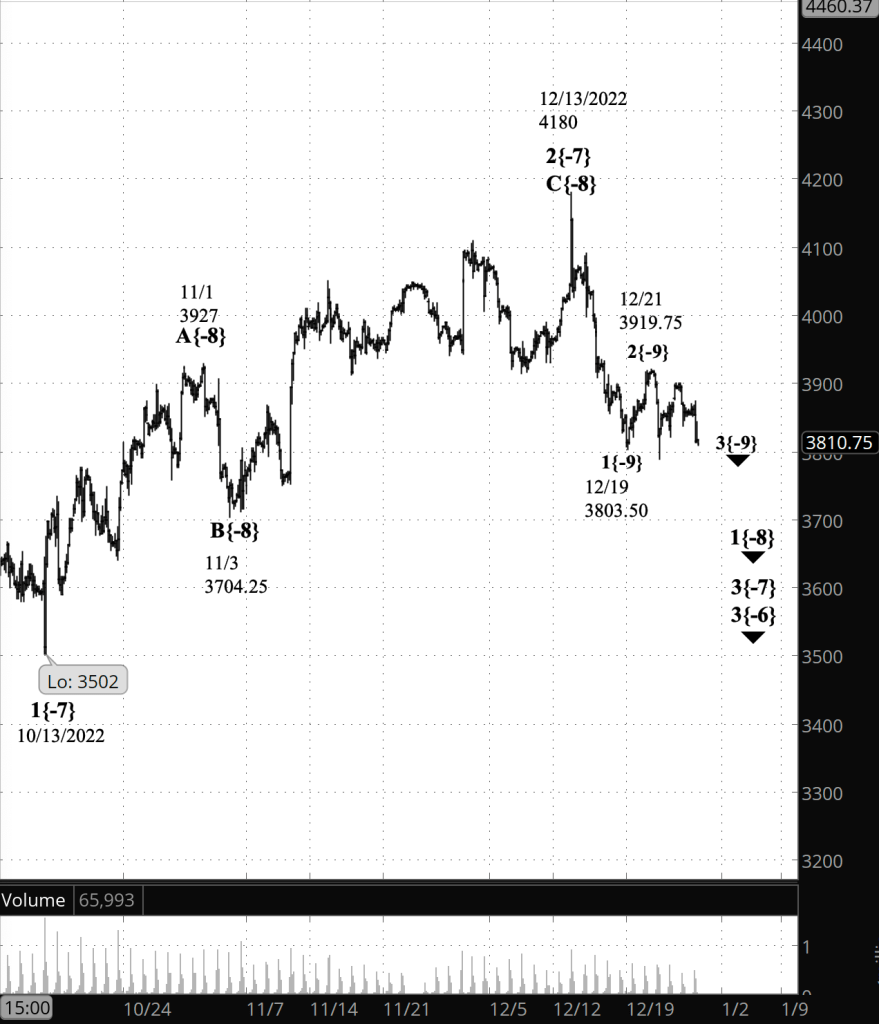
[S&P 500 E-mini futures at 3:30 p.m., 170-minute bars, with volume]
What does Elliott wave theory say? Here are the waves that are important to today’s analysis.
The principal analysis,
- The larger downtrend is wave 3{-7}, which began on December 1 from 4110.
- Internally, it is in its initial leg, wave 1{-8}.
- That initial leg is in its middle segment, wave 3{-9}, which began on December 21.
Alternatives #1 and #2,
- A larger upward correction, wave 2[-7}, is still underway.
Alternative #1,
- Wave C{-8}, a rising subwave within wave 2{-7}, is internally in a downward correction and the rise will soon resume.
Alternative #2,
- The first corrective pattern within wave 2{-7} ended on December 13 with wave C{-8}, but wave 2[-7} is still underway.
- The subsequent decline is wave X{-8}, connecting the now complete first corrective pattern with a future second corrective pattern.
- Compound corrections can contain up to three corrective patterns.
Alternative #3,
- The smaller correction is wave 2{-9} within wave 1{-8}, which in turn is a subwave of wave 3{-7}.
- The first subwave within the correction, wave A{-10}, ended on December 21, and the second subwave, B{-10}, is now underway, as wave 2{-9} continues.
We Are Here.
These are the waves currently in progress under my principal analysis. Each line on the list shows the wave number, with the subscript in curly brackets, the traditional degree name, the starting date, the starting price of the S&P 500 E-mini futures, and the direction of the wave.
- S&P 500 Index:
- 5{+3} Supercycle, 7/8/1932, 4.40 (up)
- 5{+2} Cycle, 12/9/1974, 60.96 (up)
- 5{+1} Primary, 3/6/2009, 666.79 (up)
- 5{0} Intermediate, 12/26/2018, 2346.58 (up)
- 4{-1} Minor, 1/4/2022 4818.62 (down)
- 1{-2} Minute, 1/4/2022 4818.62 (down)
- S&P 500 Futures and index:
- 1{-3} Minuette, 1/4/2022, 4808.25 (down) (futures), 4818.62 (down) (index)
- S&P 500 Futures:
- 1{-4} Subminuette, 1/4/2022, 4808.25 (down)
- 1{-5} Micro, 1/4/2022, 4808.25 (down)
- 3{-6} Submicro, 8/16/2022, 4327.50 (down)
- 3{-7} Minuscule, 12/1/2022, 4110 (down)
- 1{-8} Subminuscule, 12/1/2022, 4110 (down)
Learning and other resources. Elliott wave analysis provides context, not prophecy. As the 20th century semanticist Alfred Korzybski put it in his book Science and Sanity (1933), “The map is not the territory … The only usefulness of a map depends on similarity of structure between the empirical world and the map.” And I would add, in the ever-changing markets, we can judge that similarity of structure only after the fact.
See the menu page Analytical Methods for a rundown on where to go for information on Elliott wave analysis.
By Tim Bovee, Portland, Oregon, December 28, 2022
Disclaimer
Tim Bovee, Private Trader tracks the analysis and trades of a private trader for his own accounts. Nothing in this blog constitutes a recommendation to buy or sell stocks, options or any other financial instrument. The only purpose of this blog is to provide education and entertainment.
No trader is ever 100 percent successful in his or her trades. Trading in the stock and option markets is risky and uncertain. Each trader must make trading decisions for his or her own account, and take responsibility for the consequences.
License
All content on Tim Bovee, Private Trader by Timothy K. Bovee is licensed under a Creative Commons Attribution-ShareAlike 4.0 International License.
Based on a work at www.timbovee.com.

You must be logged in to post a comment.