3:30 p.m. New York time
Monday. U.S. markets will be closed on Monday for the President’s Day holiday. Normal trading hours will resume on Tuesday. The S&P 500 futures are likely to trade during the holiday, and if that in favt proves to be the case, then I shall post an analysis.
Half an hour before the closing bell. The S&P 500 futures moved below the February 11 low, 4060.75, increasing the likelihood that a new downtrend began on February 2 from 4208.50. The S&P 500 index had a corresponding break below, confirming the futures movement.
I’ve replaced this morning’s principal analysis with thge alternative analysis.
I’ve added a new chart showing the new principal analysis: A downtrend has begun and will carry the price below 3502, the starting point of the upward correction that ended on February 2.
In Elliott wave terminology, the downtrend is wave 3{-7}, and as a third wave, it an be expected to show a great deal of energy on its downward journey, which will likely take it significantly below 3502, the starting point of the preceding upward correction, wave 2{-7}.
If the price reverses and moves above 4208.50, then wave 2{-7} has not yet ended, this morning’s alternative analysis was incorrect, and this morning’s principal analysis better represents the chart.
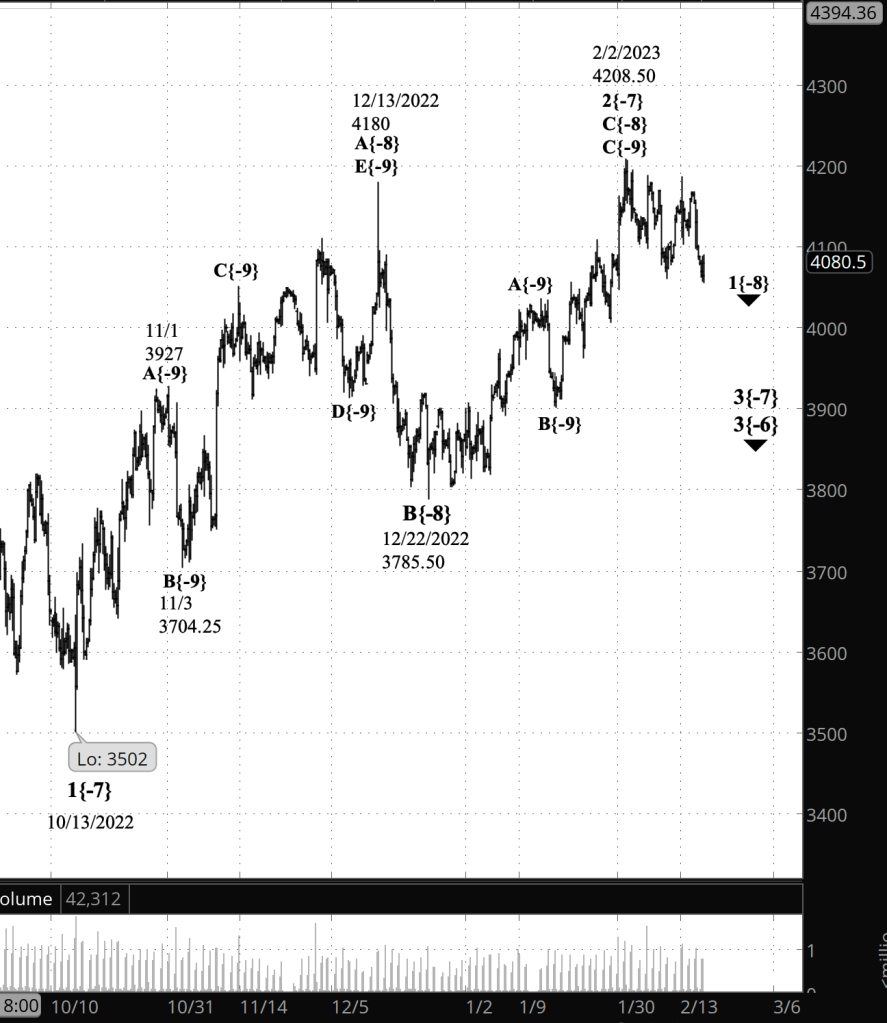
[S&P 500 E-mini futures at 3:30 p.m., 5-hour bars, with volume]
9:35 a.m. New York time
The analysis below has been outdated by events. The alternative analysis has replaced the principal analysis. See the afternoon analysis, above.
What’s happening now? The S&P 500 E-mini futures declined overnight to 4063.25, a few points above the rise that began on February 11.
What does it mean? An upward correction that began on October 13, 2022 continues and is in near it’s end. A reversal and rise above the February 2 high so far in the correction would confirm this scenario.
What is the alternative? If the price moves below the start of the rise, 4060.75, that increases the credibility of an alternative scenario, that the upward correction ended at the February 2 peak, 4208.50, and a downtrend has begun and is in its early stages. A decline below the start of the correction, 3502, would confirm this analysis. The downtrend is likely to carry the price well below 3502.
Chart note. On the chart below, directional movements — waves — are numbered of they’re within trending waves, and designated by letters if they are within corrective waves. Waves on a stock chart form a fractal pattern, larger waves encompassing smaller waves, and those smaller waves encompassing still smaller waves, forming a hierarchy. A wave’s position within the fractal hierarchy is designated by a subscript, within curly brackets. The smaller the subscript number, the further down the hierarchy a wave stands.
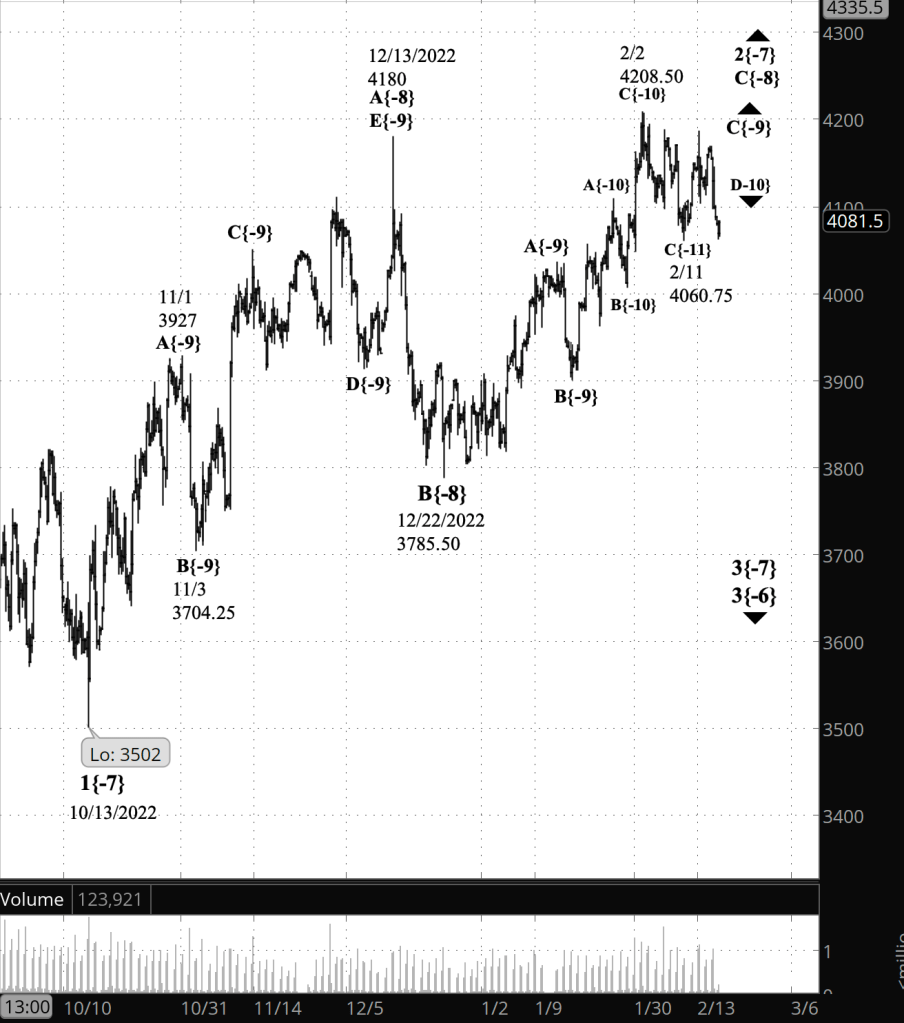
[Outdated analysis: S&P 500 E-mini futures at 9:35 a.m., 5-hour bars, with volume]
What does Elliott wave theory say? Here are the waves that my analysis is based on, unchanged from the past few days.
Principal analysis:
- The upward correction, wave 2{-7}, continues.
- It is in the third of three parts, upward wave C{-8}.
- C{-8} in turn is in its third and final subwave, rising wave C{-9}.
- Wave C{-9} has five subwaves and is in the fourth, declining wave D{-10}.
- Wave D{10} will be followed by rising wave E{-10},
- A wave in wave E{-10}’s position normally will exceed the endpoint of the prior upward wave, 4208.50, which is wave C{-10}. That peak was attained on February 2.
- The end of the wave E{-10} will also be the end of waves C{-9}, C{-8} and of the upward correction, wave 2{-7}.
- Wave 3{-7} will follow, a powerful downtrend that will carry the price below the starting point of the correction, 3502, and most likely significantly below that level.
Alternative analysis:
- The upward correction, wave 2{-7}, ended on February 2 at 4208.50 and downtrending wave 3{-7} is now underway.
Confirmation signals.
The choice between the principal and alternative analyses depends on whether wave D{-10} has ended. The chart has sufficient ambiguity to ensure that there is no obvious answer.
A breakout above 4208.50 — the end of rising wave C{-10} — would confirm that wave E{-10} is underway, A break below 4060.75 — the low point so far of wave D{-10}, 4060.75 andthe end of falling wave C{-11} — would confirm that D{-10} is still underway.
Bigger structures:
- This is all happening within wave 3{-6}, which began on August 16, 2022.
- Wave 3{-6} is encompassed by a series of larger waves, the smaller within the larger, stretching up five degrees to wave 4{-1}, which began on January 4, 2022.
- Wave 4{-1} is the next-to-the-last wave within a large expanding Diagonal Triangle, wave 5{0}, that began on December 26, 2018
We Are Here.
These are the waves currently in progress under my principal analysis. Each line on the list shows the wave number, with the subscript in curly brackets, the traditional degree name, the starting date, the starting price of the S&P 500 E-mini futures, and the direction of the wave.
- S&P 500 Index:
- 5{+3} Supercycle, 7/8/1932, 4.40 (up)
- 5{+2} Cycle, 12/9/1974, 60.96 (up)
- 5{+1} Primary, 3/6/2009, 666.79 (up)
- 5{0} Intermediate, 12/26/2018, 2346.58 (up)
- S&P 500 Futures and index:
- 4{-1} Minor, 1/4/2022, 4808.25 (down) (futures), 4818.62 (down) (index)
- S&P 500 Futures:
- 1{-2} Minute, 1/4/2022, 4808.25 (down)
- 1{-3} Minuette, 1/4/2022, 4808.25 (down)
- 1{-4} Subminuette, 1/4/2022, 4808.25 (down)
- 1{-5} Micro, 1/4/2022, 4808.25 (down)
- 3{-6} Submicro, 8/16/2022, 4327.50 (down)
- 3{-7} Minuscule, 2/2/2023, 4208.50 (down)
Learning and other resources. Elliott wave analysis provides context, not prophecy. As the 20th century semanticist Alfred Korzybski put it in his book Science and Sanity (1933), “The map is not the territory … The only usefulness of a map depends on similarity of structure between the empirical world and the map.” And I would add, in the ever-changing markets, we can judge that similarity of structure only after the fact.
See the menu page Analytical Methods for a rundown on where to go for information on Elliott wave analysis.
By Tim Bovee, Portland, Oregon, February 17, 2023
Disclaimer
Tim Bovee, Private Trader tracks the analysis and trades of a private trader for his own accounts. Nothing in this blog constitutes a recommendation to buy or sell stocks, options or any other financial instrument. The only purpose of this blog is to provide education and entertainment.
No trader is ever 100 percent successful in his or her trades. Trading in the stock and option markets is risky and uncertain. Each trader must make trading decisions for his or her own account, and take responsibility for the consequences.
License
All content on Tim Bovee, Private Trader by Timothy K. Bovee is licensed under a Creative Commons Attribution-ShareAlike 4.0 International License.
Based on a work at www.timbovee.com.

You must be logged in to post a comment.