9:35 a.m. New York time
What’s happening now? The S&P 500 E-mini futures kept to a narrow range after trading resumed Sunday evening, remaining in the 4070s and 4080s. U.S. stock and options markets are closed today for the President’s Day holiday. Futures traded while overseas markets were open.
No afternoon analysis today, unless the chart changes meaningfully.
What does it mean? A downtrending wave that will carry the price significantly lower began on February 2 from 4208.50 and is in its early stage. As with all directional movements, it will contain both waves in the direction of the trend and counter-trend corrections. The downtrend will carry the price below 3502, the starting point of the preceding upward correction, which began on October 13, 2022, and most likely significantly below that level. The further the price declines, the more likely this scenario becomes. A drop below 3502 will confirm the analysis.
What is the alternative? The upward correction is still underway. The February 2 peak marked the beginning of a small downward correction within the larger upward correction. The rise will resume shortly and will carry the price above 4208.50. The higher the price rises, the more likely this scenario becomes. A rise above 4208.50 will confirm the scenario.
Chart note. Each wave’s designation — a number or letter — has a subscript, in curly brackets, to indicate the wave’s place, its degree, within the fractal structure of the price movements.
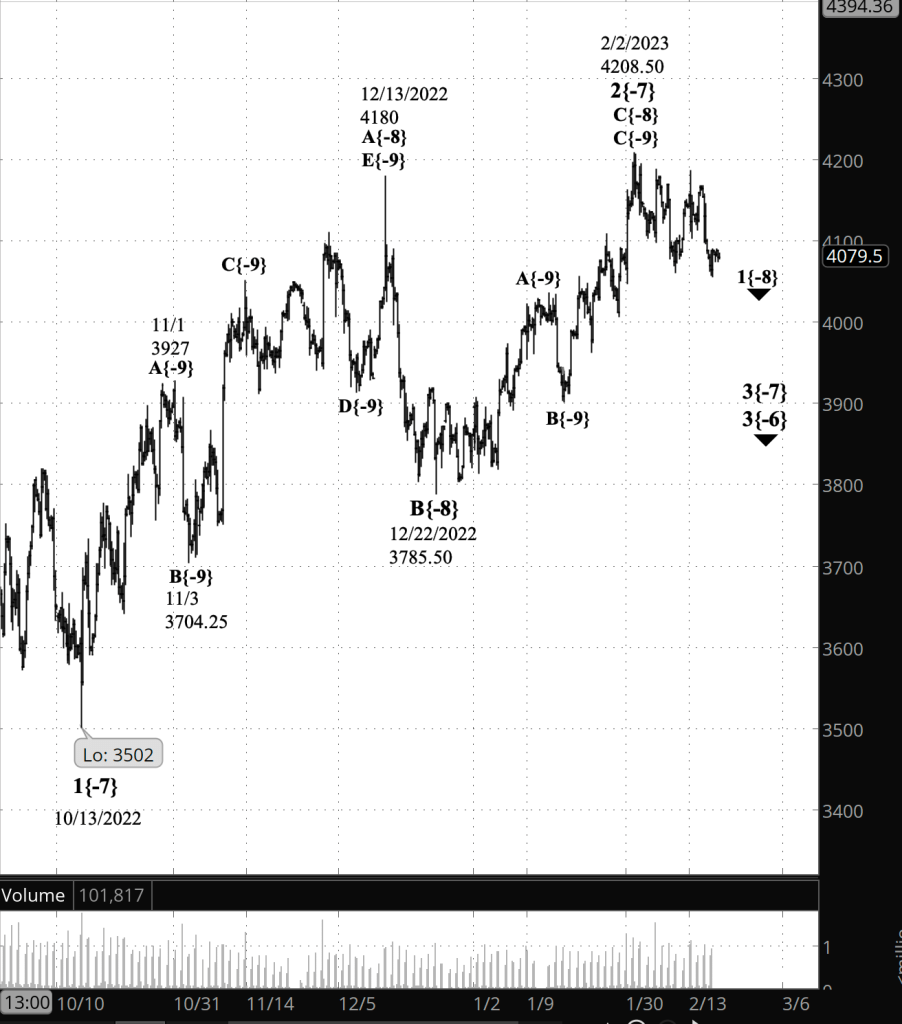
[S&P 500 E-mini futures at 9:35 a.m., 5-hour bars, with volume]
What does Elliott wave theory say? Here are the waves that my analyses are based on.
Principal analysis:
- The downward correction that began on February 2, wave 3{-7}, continues.
- It is in the first of five subwaves, wave 1{-8}.
- Wave 3{-7} will develop into a powerful downtrend that will carry the price below 3502, the starting point of the preceding upward correction, wave 2{-7}, and most likely significantly below that level.
Alternative analysis:
- The upward correction that began on October 13, 2022, wave 2{-7}, is still underway.
- It is in the third of three parts, upward wave C{-8}.
- C{-8} in turn is in its third and final subwave, rising wave C{-9}.
- Wave C{-9} has five subwaves and is in the fourth, declining wave D{-10}.
- Wave D{10} will be followed by rising wave E{-10},
- A wave in wave E{-10}’s position normally will exceed the endpoint of the prior upward wave, 4208.50, which is wave C{-10}. That peak was attained on February 2.
- The end of the wave E{-10} will also be the end of waves C{-9}, C{-8} and of the upward correction, wave 2{-7}.
- Wave 3{-7} will follow, a powerful downtrend that will carry the price below the starting point of the correction, 3502, and most likely significantly below that level.
Confirmation signals.
The principal analysis will be confirmed if the present decline, wave 3{-7} and its subwaves move below 3502.
The alternative analysis will be confirmed if the present decline, wave D{-10}, moves above 4208.50.
Bigger structures:
- This is all happening within wave 3{-6}, which began on August 16, 2022.
- Wave 3{-6} is encompassed by a series of larger waves, the smaller within the larger, stretching up five degrees to wave 4{-1}, which began on January 4, 2022.
- Wave 4{-1} is the next-to-the-last wave within a large expanding Diagonal Triangle, wave 5{0}, that began on December 26, 2018
We Are Here.
These are the waves currently in progress under my principal analysis. Each line on the list shows the wave number, with the subscript in curly brackets, the traditional degree name, the starting date, the starting price of the S&P 500 E-mini futures, and the direction of the wave.
- S&P 500 Index:
- 5{+3} Supercycle, 7/8/1932, 4.40 (up)
- 5{+2} Cycle, 12/9/1974, 60.96 (up)
- 5{+1} Primary, 3/6/2009, 666.79 (up)
- 5{0} Intermediate, 12/26/2018, 2346.58 (up)
- S&P 500 Futures and index:
- 4{-1} Minor, 1/4/2022, 4808.25 (down) (futures), 4818.62 (down) (index)
- S&P 500 Futures:
- 1{-2} Minute, 1/4/2022, 4808.25 (down)
- 1{-3} Minuette, 1/4/2022, 4808.25 (down)
- 1{-4} Subminuette, 1/4/2022, 4808.25 (down)
- 1{-5} Micro, 1/4/2022, 4808.25 (down)
- 3{-6} Submicro, 8/16/2022, 4327.50 (down)
- 3{-7} Minuscule, 2/2/2023, 4208.50 (down)
Learning and other resources. Elliott wave analysis provides context, not prophecy. As the 20th century semanticist Alfred Korzybski put it in his book Science and Sanity (1933), “The map is not the territory … The only usefulness of a map depends on similarity of structure between the empirical world and the map.” And I would add, in the ever-changing markets, we can judge that similarity of structure only after the fact.
See the menu page Analytical Methods for a rundown on where to go for information on Elliott wave analysis.
By Tim Bovee, Portland, Oregon, February 20, 2023
Disclaimer
Tim Bovee, Private Trader tracks the analysis and trades of a private trader for his own accounts. Nothing in this blog constitutes a recommendation to buy or sell stocks, options or any other financial instrument. The only purpose of this blog is to provide education and entertainment.
No trader is ever 100 percent successful in his or her trades. Trading in the stock and option markets is risky and uncertain. Each trader must make trading decisions for his or her own account, and take responsibility for the consequences.
License
All content on Tim Bovee, Private Trader by Timothy K. Bovee is licensed under a Creative Commons Attribution-ShareAlike 4.0 International License.
Based on a work at www.timbovee.com.

You must be logged in to post a comment.