3:30 p.m. New York time
Half an hour before the closing bell. The S&P 500, index and futures, continued to fall during the session, with the futures reaching into the 3980s. The power of the decline pretty much eliminates this morning’s alternative analysis. Downtrending wave 5{-12} is underway and, if typical, can be expected to reach below 3947.50, and perhaps significantly lower.
How long will it last? Wave 3{-12} lasted for 17 calendar days. There’s no guarantee that wave 5{-12} will equal that, but it will likely be proportional to the 3rd wave. So that would give us March 23 plus or minus quite a bit as a reasonable, very tentative target.
What happens next? Wave 5{-12}, at its end, will also be the end of wave 3{-11}, which began on February 14. What happens next? Wave 4{-11} will commence. It is an upward correction one degree larger than the wave 4{-12} correction that ended yesterday. Wave 4{-12} lasted for 12 days, and wave 4{-11}, being of a larger degree, can be expected to last somewhat longer, if it’s typical.
And wave 4{-11}, when it ends, will mark the beginning of downtrending wave 5{-10}, another degree larger, which began on February 14.
So mid-February saw a busy few days on the chart, as three degrees of waves began on three consecutive days.
A new alternative. With the decline that began on March 6 firmly launched, the chart faces a new possibility: The upward correction that just ended under the principal analysis may be forming a compound correction. If that’s the case, then the correction hasn’t ended yet.
A compound correction links two or three corrective patterns together. Under the alternative scenario, what ended on March 6 was the first corrective pattern within wave 4{-12}, containing three waves internally. The present decline, under this alternative analysis, is wave X{-13}, which will connect the first corrective pattern with a second corrective pattern. I consider this to be less likely than the principal scenario, which see the correction as having ended. Nonetheless, an alternative correction can’t be ruled out entirely.
I’ve updated the chart.
9:35 a.m. New York time
What’s happening now? The S&P 500 E-mini futures traded narrowly overnight, staying in the 4050s and 4060s, then declining into the 4040s as the opening bell sounded.
What does it mean? The downtrend that began from yesterday’s peak and reversal, at 4082.40, continues and is in its early stages. The downtrend will eventually carry the price below 3947.50 — the starting point of the upward correction that began on February 22 — and most likely significantly below that level.
What are the alternatives? It remains possible that the price will move above yesterday’s high. If that should happen, then the final stage of the upward correction still had a bit more upside in it. Under the rules of Elliott wave analysis, a move above 4098.25 — the end of the preceding initial part of the larger downtrend that began on February 15 — will invalidate the present analysis and this alternative and will require a reanalysis of the chart.
That possible invalidation holds true even if a news event causes a momentary rise above 4098.25. One thing to watch for this morning is Federal Reserve Chair Jerome Powell’s appearance before the Senate Banking Committee to deliver his twice-a-year-monetary policy report. The hearing begins at 10 a.m. New York time.
Reading the chart. Elliott wave analysis views the chart as a complex structure of smaller waves nested within larger waves, which in turn are nested within still larger waves. My labeling system assigns numbers to the subwaves of trending waves, and letters to the subwaves of corrections. Each number or letter is followed by a subscript, in curly brackets, showing the waves position within the complex structure, called its “degree” in Elliott wave parlance. The smaller the number, the lower the degree. On this chart we’re dealing with relatively small waves, so the degree numbers are negative.
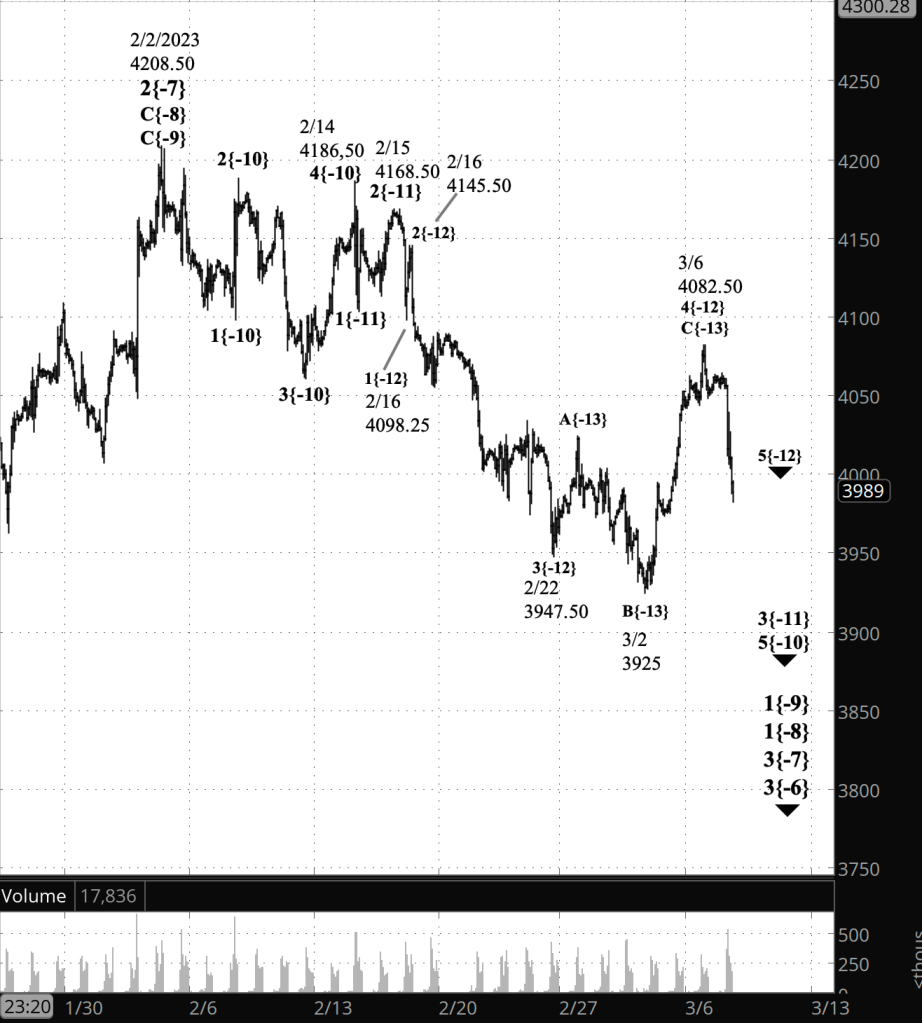
[S&P 500 E-mini futures at 3:30 p.m., 80-minute bars, with volume]
What does Elliott wave theory say? These are the waves that are I’m tracking.
Principal analysis:
- The downward correction that began on February 2, wave 3{-7}, continues.
- It is in the first of five subwaves, wave 1{-8}.
- Within wave 1{-8}, wave 1{-9} is underway and is in the final subwave within a five-wave structure, downtrending wave 5{-10}.
- Wave 5{-10}, in turn, is in its middle wave, 3{-11}.
- Wave 3{-11}’s middle wave, wave 3{-12}, ended on February 22, and the next-to-the-last wave, an upward correction, wave 4{-12}, is now underway.
- Internally, wave 4{-12} is in its final wave of three, C{-13}.
- Wave C{-13} will have five waves internally, appears to have just completed wave C{-14} and may have completed wave D{-14} and to have launched its final wave, E{-14}, which will complete the parent wave, C{-13}.
- The end of wave C{-13} will be the end of the correction, wave 4{-12}, which will be followed by wave 5{-12}, which will mark the end of wave 3{-11}, a subwave of downtrending wave 5{-10}.
- The end of wave 5{-12} will also be the end of wave 3{-11}, a subwave of downtrending wave 5{-10}.
- When wave 5{-10} is complete, it will also mark the end of wave 1{-9} and the beginning of a low-degree upward correction, wave 2{-9}.
- Wave 3{-7} is still taking its tentative first steps and will develop into a powerful downtrend that will carry the price below 3502, the starting point of the preceding upward correction, wave 2{-7}, and most likely significantly below that level.
Alternative analysis:
- Wave 4{-12}, an upward correction, is still underway.
- It is in its third internal wave, C{-13}.
- The end of C{-13} will also be the end of wave 4{-12} and the starting point of a downtrend, wave 5{-12}, which will carry the price below 3947.50 — the starting point of wave 4{-12} and perhaps significantly below that level.
Bigger structures:
- This is all happening within wave 3{-6}, which began on August 16, 2022.
- Wave 3{-6} is encompassed by a series of larger waves, the smaller within the larger, stretching up five degrees to wave 4{-1}, which began on January 4, 2022.
- Wave 4{-1} is the next-to-the-last wave within a large expanding Diagonal Triangle, wave 5{0}, that began on December 26, 2018
- When wave 4{-1} is complete, wave 5{-1} will begin and will carry the wave above the January 4 high, 4808.25, and into the 6000s, where the present upper boundary of the triangle lies. The expanding part means that each day that upper boundary moves higher.
We Are Here.
These are the waves currently in progress under my principal analysis. Each line on the list shows the wave number, with the subscript in curly brackets, the traditional degree name, the starting date, the starting price of the S&P 500 E-mini futures, and the direction of the wave.
- S&P 500 Index:
- 5{+3} Supercycle, 7/8/1932, 4.40 (up)
- 5{+2} Cycle, 12/9/1974, 60.96 (up)
- 5{+1} Primary, 3/6/2009, 666.79 (up)
- 5{0} Intermediate, 12/26/2018, 2346.58 (up)
- S&P 500 Futures and index:
- 4{-1} Minor, 1/4/2022, 4808.25 (down) (futures), 4818.62 (down) (index)
- S&P 500 Futures:
- 1{-2} Minute, 1/4/2022, 4808.25 (down)
- 1{-3} Minuette, 1/4/2022, 4808.25 (down)
- 1{-4} Subminuette, 1/4/2022, 4808.25 (down)
- 1{-5} Micro, 1/4/2022, 4808.25 (down)
- 3{-6} Submicro, 8/16/2022, 4327.50 (down)
- 3{-7} Minuscule, 2/2/2023, 4208.50 (down)
Learning and other resources. Elliott wave analysis provides context, not prophecy. As the 20th century semanticist Alfred Korzybski put it in his book Science and Sanity (1933), “The map is not the territory … The only usefulness of a map depends on similarity of structure between the empirical world and the map.” And I would add, in the ever-changing markets, we can judge that similarity of structure only after the fact.
See the menu page Analytical Methods for a rundown on where to go for information on Elliott wave analysis.
By Tim Bovee, Portland, Oregon, March 7, 2023
Disclaimer
Tim Bovee, Private Trader tracks the analysis and trades of a private trader for his own accounts. Nothing in this blog constitutes a recommendation to buy or sell stocks, options or any other financial instrument. The only purpose of this blog is to provide education and entertainment.
No trader is ever 100 percent successful in his or her trades. Trading in the stock and option markets is risky and uncertain. Each trader must make trading decisions for his or her own account, and take responsibility for the consequences.
License
All content on Tim Bovee, Private Trader by Timothy K. Bovee is licensed under a Creative Commons Attribution-ShareAlike 4.0 International License.
Based on a work at www.timbovee.com.

You must be logged in to post a comment.