3:30 p.m. New York time
Half an hour before the closing bell. A bit of a yawner today, with the S&P 50 futures declining only slightly, into the 3970s. This despite Fed Chair Jerome Powell’s second day of testimony before congressional committees, this time in the House. No change in the analysis. I’ve updated the chart.
1:15 p.m. New York time
MKC options bear spread entry. I’ve entered a short bear call vertical spread on MKC, using options that expire 44 days hence, and have posted an analysis of the trade.
9:35 a.m. New York time
What’s happening now? The S&P 500 E-mini futures moved sideways overnight, remaining in the 3980s and 3990s with a brief push above 4000 that quickly retreated.
What does it mean? The pause was a small correction within a larger downtrend that began on March 6. The downtrend is in a very early phase. It is the final wave within a series of increasingly larger downtrends that began in February, which in turn a part of still larger downtrends that began on January 4 and later.
Bottom line: Think bear market, and it has quite some time to go.
If the downtrend is typical, it will fall below the starting point of the preceding correction, which in this case is 3947.50, and perhaps significantly below that price.
What are the alternatives? Occasionally a correction will form a compound structure, linking two or three corrective patterns together, with each pattern being separated by a single wave in the direction opposite that of the correction. If that proves to be the case, then the upward correction that began on February 22 is still underway, the first corrective pattern ended on March 6, and the present decline is a connector wave that will be followed by a second corrective pattern.
Reading the chart. Elliott wave analysis views the chart as a complex structure of smaller waves nested within larger waves, which in turn are nested within still larger waves. My labeling system assigns numbers to the subwaves of trending waves, and letters to the subwaves of corrections. Each number or letter is followed by a subscript, in curly brackets, showing the waves position within the complex structure, called its “degree” in Elliott wave parlance. The smaller the number, the lower the degree. On this chart we’re dealing with relatively small waves, so the degree numbers are negative.
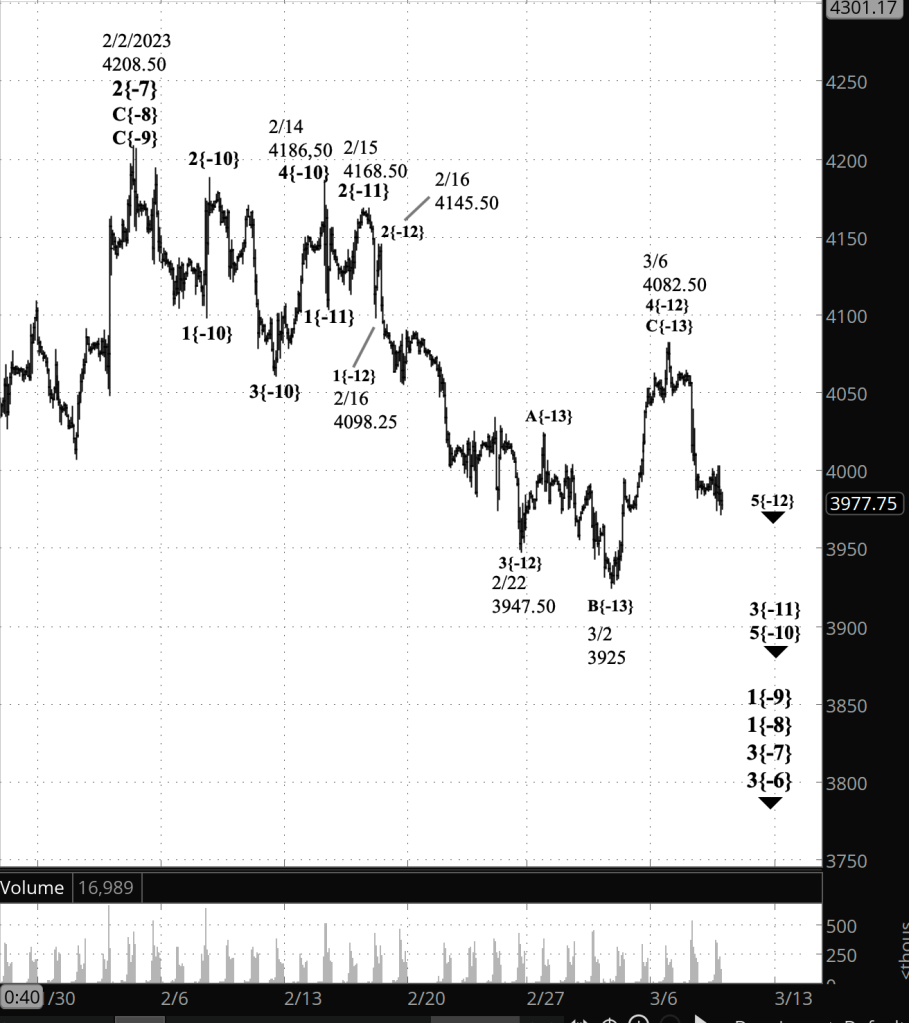
[S&P 500 E-mini futures at 3:30 p.m., 80-minute bars, with volume]
What does Elliott wave theory say? A discussion of the waves of interest using the wave numbers and degree subscripts.
Principal analysis:
- The downward correction that began on February 2, wave 3{-7}, continues.
- It is in the first of five subwaves, wave 1{-8}.
- Within wave 1{-8}, wave 1{-9} is underway and is in the final subwave within a five-wave structure, downtrending wave 5{-10}.
- Wave 5{-10}, in turn, is in its middle wave, 3{-11}.
- Wave 3{-11}’s middle wave, wave 3{-12}, ended on February 22, and the next-to-the-last wave, an upward correction, wave 4{-12}, is now underway.
- Internally, wave 4{-12} is in its final wave of three, C{-13}.
- Wave C{-13} will have five waves internally, appears to have just completed wave C{-14} and may have completed wave D{-14} and to have launched its final wave, E{-14}, which will complete the parent wave, C{-13}.
- The end of wave C{-13} will be the end of the correction, wave 4{-12}, which will be followed by wave 5{-12}, which will mark the end of wave 3{-11}, a subwave of downtrending wave 5{-10}.
- The end of wave 5{-12} will also be the end of wave 3{-11}, a subwave of downtrending wave 5{-10}.
- When wave 5{-10} is complete, it will also mark the end of wave 1{-9} and the beginning of a low-degree upward correction, wave 2{-9}.
- Wave 3{-7} is still taking its tentative first steps and will develop into a powerful downtrend that will carry the price below 3502, the starting point of the preceding upward correction, wave 2{-7}, and most likely significantly below that level.
Alternative analysis:
- Wave 4{-12}, an upward correction that began on February 22, is still underway and is forming a compound structure, linking two or three corrective patterns together..
- A falling wave connecting the now complete first corrective pattern — waves A{-13}, B{-13} and C{-13} — with a future second corrective pattern is now underway and is designated wave X{-13}.
Bigger structures:
- This is all happening within wave 3{-6}, which began on August 16, 2022.
- Wave 3{-6} is encompassed by a series of larger waves, the smaller within the larger, stretching up five degrees to wave 4{-1}, which began on January 4, 2022.
- Wave 4{-1} is the next-to-the-last wave within a large expanding Diagonal Triangle, wave 5{0}, that began on December 26, 2018
- When wave 4{-1} is complete, wave 5{-1} will begin and will carry the wave above the January 4 high, 4808.25, and into the 6000s, where the present upper boundary of the triangle lies. The expanding part means that each day that upper boundary moves higher.
We Are Here.
These are the waves currently in progress under my principal analysis. Each line on the list shows the wave number, with the subscript in curly brackets, the traditional degree name, the starting date, the starting price of the S&P 500 E-mini futures, and the direction of the wave.
- S&P 500 Index:
- 5{+3} Supercycle, 7/8/1932, 4.40 (up)
- 5{+2} Cycle, 12/9/1974, 60.96 (up)
- 5{+1} Primary, 3/6/2009, 666.79 (up)
- 5{0} Intermediate, 12/26/2018, 2346.58 (up)
- S&P 500 Futures and index:
- 4{-1} Minor, 1/4/2022, 4808.25 (down) (futures), 4818.62 (down) (index)
- S&P 500 Futures:
- 1{-2} Minute, 1/4/2022, 4808.25 (down)
- 1{-3} Minuette, 1/4/2022, 4808.25 (down)
- 1{-4} Subminuette, 1/4/2022, 4808.25 (down)
- 1{-5} Micro, 1/4/2022, 4808.25 (down)
- 3{-6} Submicro, 8/16/2022, 4327.50 (down)
- 3{-7} Minuscule, 2/2/2023, 4208.50 (down)
Learning and other resources. Elliott wave analysis provides context, not prophecy. As the 20th century semanticist Alfred Korzybski put it in his book Science and Sanity (1933), “The map is not the territory … The only usefulness of a map depends on similarity of structure between the empirical world and the map.” And I would add, in the ever-changing markets, we can judge that similarity of structure only after the fact.
See the menu page Analytical Methods for a rundown on where to go for information on Elliott wave analysis.
By Tim Bovee, Portland, Oregon, March 8, 2023
Disclaimer
Tim Bovee, Private Trader tracks the analysis and trades of a private trader for his own accounts. Nothing in this blog constitutes a recommendation to buy or sell stocks, options or any other financial instrument. The only purpose of this blog is to provide education and entertainment.
No trader is ever 100 percent successful in his or her trades. Trading in the stock and option markets is risky and uncertain. Each trader must make trading decisions for his or her own account, and take responsibility for the consequences.
License
All content on Tim Bovee, Private Trader by Timothy K. Bovee is licensed under a Creative Commons Attribution-ShareAlike 4.0 International License.
Based on a work at www.timbovee.com.

You must be logged in to post a comment.