3:30 p.m. New York time
Half an hour before the opening bell. The S&P 500 E-mini futures have continued their rise, extending beyond prior expectations and pressing toward levels that raise questions about the current wave labeling.
What does it mean? The issue centers on how an expanding triangle behaves under Elliott Wave Theory, and how far its internal waves can stretch.
At the top level, an expanding triangle consists of five legs—A, B, C, D, and E. Each successive leg moves beyond the prior extreme in the same direction, creating the widening shape that defines the pattern. In that sense, “overruns” are not only allowed but required at the level of the triangle itself.
Each of those legs is also a corrective structure, typically composed of three subwaves. Within corrective patterns—particularly flats and more complex corrections—B waves can retrace all of wave A and, in some cases, move beyond its starting point.
The interaction between those two ideas is not explicitly set out in the standard Elliott Wave literature, including Elliott Wave Principle. The interpretation used here is a logical extension of those principles rather than a formal rule.
The practical question is whether the internal movement still preserves the overall geometry of the triangle. If the price action stretches in a way that distorts the recognizable A–B–C–D–E structure, then the labeling is no longer consistent with the chart.
In practical terms, the chart—not the rulebook—has the final say. If price movement materially exceeds what the current labeling can reasonably accommodate, then the map no longer matches the terrain, and the count must be revised.
Decision Points. The advance is now approaching a level where the current wave labeling is being tested. A continued rise that materially exceeds the start of wave A{-6} would weaken the case for the present interpretation and suggest that the count requires revision. On the downside, a break below the most recent intraday support—roughly the 6920 area—would be the first indication that the upward phase has lost momentum and that a transition toward a declining phase may be underway. Until one of those conditions is met, the working assumption remains that the current structure is still unfolding.
9:35 a.m. New York time
What’s happening now. The S&P 500 E-mini futures resumed their rise overnight, reaching a new high within the advance that began on March 30. The overnight low was 6920.25, and the new high is 6949.50.
What does it mean? The new high confirms that wave B{-6} continues under Elliott Wave Theory analysis. The structure remains corrective and somewhat uneven, which is typical for B waves, but the upward progression is intact.
Decision Points. The immediate question is whether this advance is nearing completion or has further room to run. A sustained move above 6950 would strengthen the case for continued upside within wave B{-6}. Conversely, a break below the overnight low at 6920.25 would be the first indication that the upward phase may be ending and that a transition toward wave C{-6} could be underway. Until one of those levels is clearly broken, the working assumption remains that wave B{-6} is still in progress.
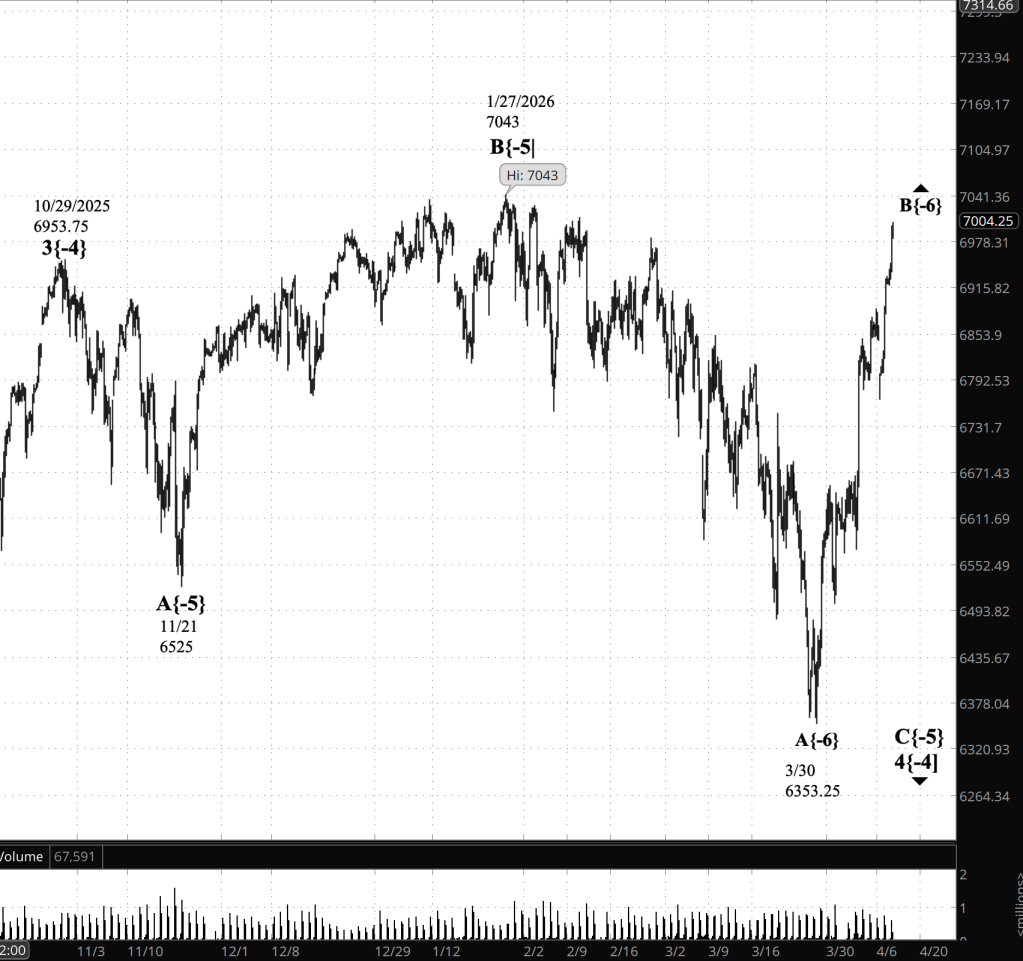
[S&P 500 E-mini futures at 3:30 p.m., 4-hour bars with volume]
Waves Now Underway
These are the waves currently in progress under my principal analysis. Each line on the list shows the wave number, with the subscript in curly brackets, the traditional degree name, the starting date, the starting price of the S&P 500 E-mini futures, and the direction of the wave.
- S&P 500 Index:
- 5{+3} Supercycle, 7/8/1932, 4.40 (up)
- 5{+2} Cycle, 12/9/1974, 60.96 (up)
- 5{+1} Primary, 3/6/2009, 666.79 (up)
- 5{0} Intermediate, 2/11/2016, 1810.10 (up)
- 3{-1} Minor, 3/23/2020, 2191.36 (up)
- 1{-2} Minute, 7/31/2025, 6468.50 (down)
- S&P 500 E-mini futures
- 5{-3} Minuette 8/1/2025, 6239.50 (up}
- 4{-4} Subminutte 10/29/2025, 6953.75 (down}
- C{-5} Micro, 1/27/2026, 7043 (down}
- B{-6} (none), 3/30/2026, 6353.25 (up}
Reading the chart. Price movements — waves – – in Elliott Wave Theory analysis are labeled with numbers within trending waves and letters with corrective waves. The subscripts — numbers in curly brackets — designate the wave’s degree, which, in Elliott Wave analysis, means the relative position of a wave within the larger and smaller structures that make up the chart. R.N. Elliott, who in the 1930s developed the form of analysis that bears his name, viewed the chart as a complex structure of smaller waves nested within larger waves, which in turn are nested within still larger waves. In mathematics it’s called a fractal structure, where at every scale the pattern is similar to the others.
Learning and other resources. Elliott Wave analysis provides context, not prophecy. As the 20th century semanticist Alfred Korzybski put it in his book Science and Sanity (1933), “The map is not the territory … The only usefulness of a map depends on similarity of structure between the empirical world and the map.” And I would add, in the ever-changing markets, we can judge that similarity of structure only after the fact.
See the menu page Analytical Methods for a rundown on where to go for information on Elliott Wave analysis.
By Tim Bovee, Portland, Oregon, April 14, 2026
Disclaimer
Tim Bovee, Private Trader tracks the analysis and trades of a private trader for his own accounts. Nothing in this blog constitutes a recommendation to buy or sell stocks, options or any other financial instrument. The only purpose of this blog is to provide education and entertainment.
No trader is ever 100 percent successful in his or her trades. Trading in the stock and option markets is risky and uncertain. Each trader must make trading decisions for his or her own account, and take responsibility for the consequences.
All content on Tim Bovee, Private Trader by Timothy K. Bovee is licensed under a Creative Commons Attribution-ShareAlike 4.0 International License.
Based on work at www.timbovee.com

You must be logged in to post a comment.