3:30 p.m. New York time
Half an hour before the closing bell. The S&P 500 futures have moved above 7043, the last major turning point, and into the 7050s.
Elliott Wave Theory. The last turning point marked the beginning of wave A{-6}. That wave ended on March 30 at 6353.25, and wave B{-6} began. It is that rising wave B{-6} that has now moved above the beginning of wave A{-6}, and that breaks a rule of Elliott Wave Theory.
Waves A{-6} and B{-6} had been labeled as subwaves of wave C{-5}, which in turn is a subwave of corrective wave 4{-4}, taking the form of an expanding triangle.
It is a firm rule of Elliott Wave Theory that in an expanding triangle, a rising B wave cannot move above the start of the previous A wave. If it does, then the chart’s wave labeling is wrong. The map no longer matches the terrain, and it is the map that must change. Always.
I have changed the labels to eliminate the error. What had been wave A{-6} becomes declining wave C{-5}, one degree higher. And the present wave B{-6} becomes wave D{-5}, the next-to-last subwave of wave 4{-4}.
The observation of Robert Prechter, who helped revive the popularity of Elliott Wave Theory in 1978 at a time when that remarkable tool had nearly been forgotten, says it well: “No subwave has been observed to subdivide into a triangle.” The triangle form is reserved for the parent wave, not its subwaves.
Decision Points. The next question is whether rising wave D{-5} is nearing completion or still has room to run. Continued strength above 7043 would keep the present interpretation intact and point toward additional upside within wave D{-5}. A reversal downward from the current area would suggest that wave D{-5} is ending and that declining wave E{-5}, the final subwave of wave 4{-4}, may be beginning. The higher this rise goes before turning, the more room there would be for that final decline.
New labels chart (current version).
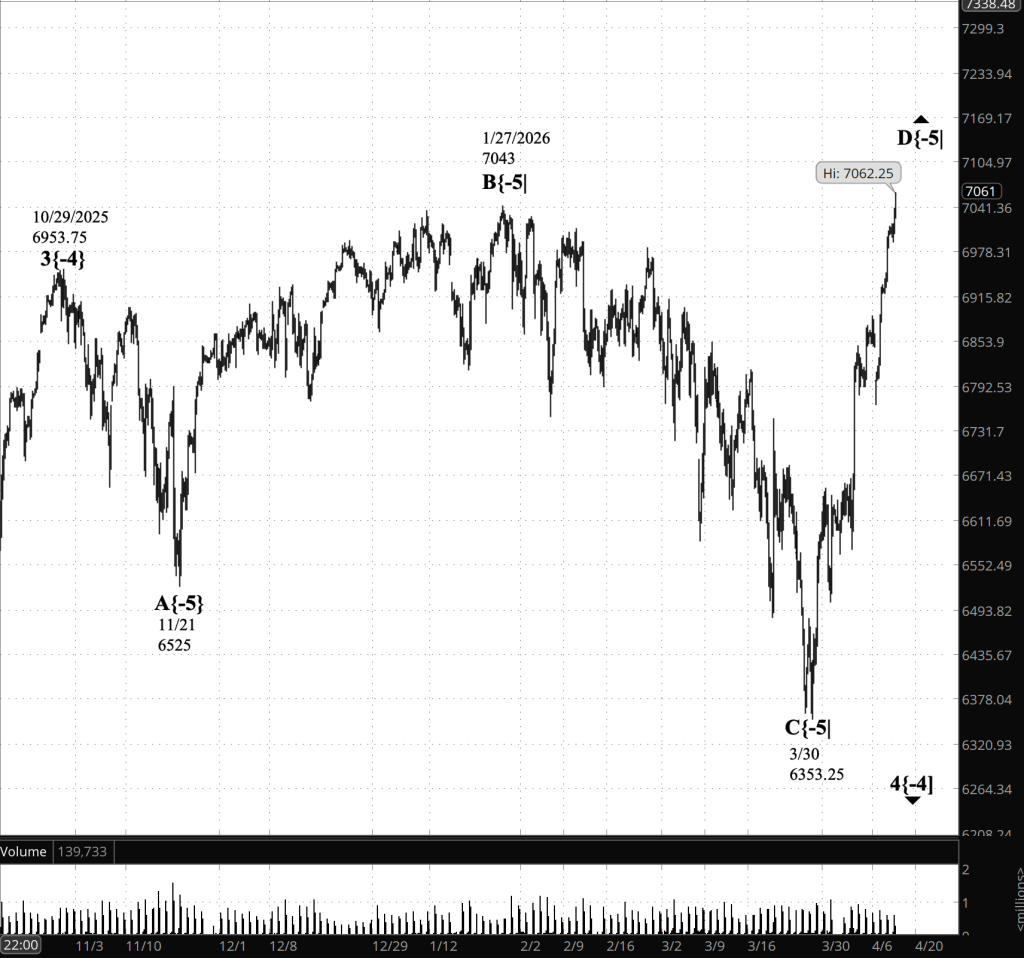
[S&P 500 E-mini futures at 3:30 P.m., 4-hour bars with volume]
9:35 a.m. New York time
What’s happening now. The S&P 500 E-mini futures declined overnight to 6991.75 and then rose to the 7010s — at one point spiking to 7018 and immediately withdrawing. The price rose sharply as the opening bell still echoed, reaching 7024.25 and then falling back.
What does it mean? Elliott Wave Theory analysis sees wave B{-6} as continuing, although the wave appears to be in its end game and losing the energy needed to sustain the rise. It may regain that energy and push higher, or it may fail and turn down. At this stage, the structure remains incomplete, and the outcome uncertain.
Decision Points. A sustained move above 7018 would indicate that wave B{-6} is extending and could open the way toward the 7025–7040 resistance zone. Failure in the 7010–7020 area, followed by a lower high, would be an early indication that the wave is topping. A break below 6990 would signal increasing downside pressure, and a move below 6950 would provide stronger evidence that a downward wave C{-6} is underway.
Former labels chart (now outdated).
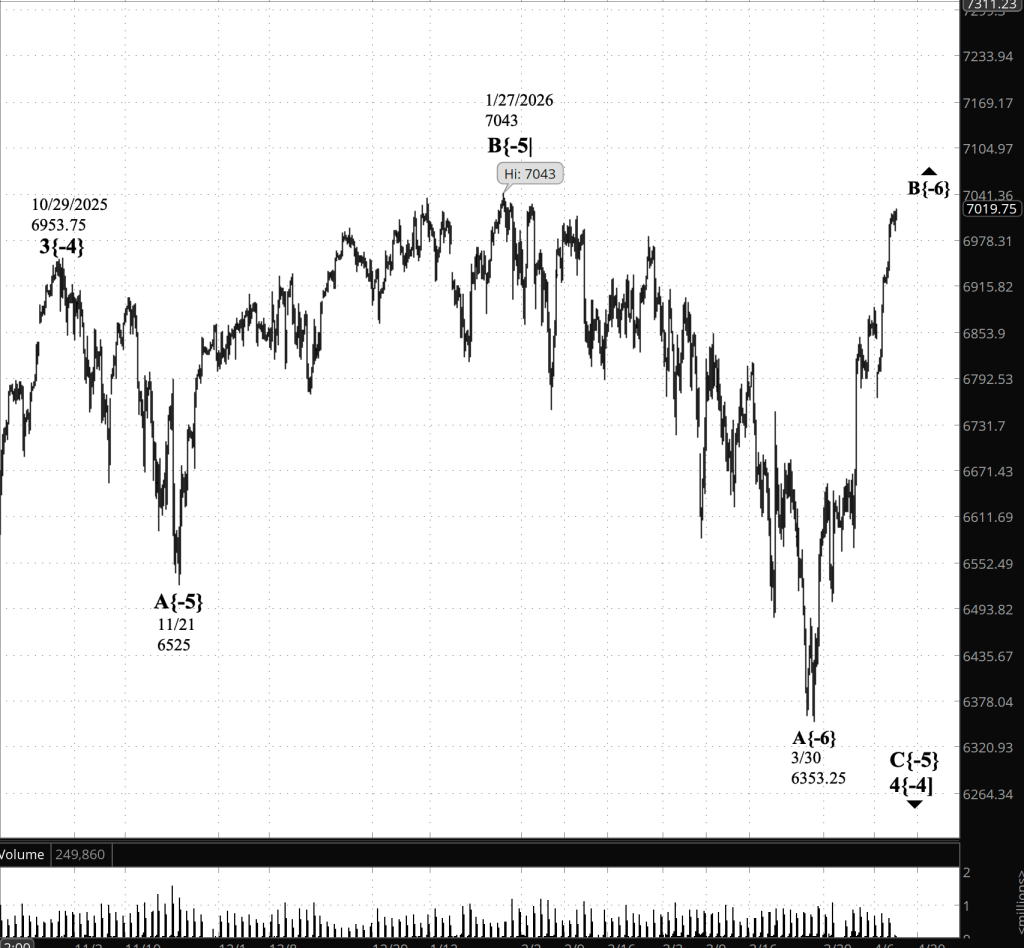
[S&P 500 E-mini futures at 9:35 a.m., 4-hour bars with volume]
Waves Now Underway
These are the waves currently in progress under my principal analysis. Each line on the list shows the wave number, with the subscript in curly brackets, the traditional degree name, the starting date, the starting price of the S&P 500 E-mini futures, and the direction of the wave.
- S&P 500 Index:
- 5{+3} Supercycle, 7/8/1932, 4.40 (up)
- 5{+2} Cycle, 12/9/1974, 60.96 (up)
- 5{+1} Primary, 3/6/2009, 666.79 (up)
- 5{0} Intermediate, 2/11/2016, 1810.10 (up)
- 3{-1} Minor, 3/23/2020, 2191.36 (up)
- 1{-2} Minute, 7/31/2025, 6468.50 (down)
- S&P 500 E-mini futures
- 5{-3} Minuette 8/1/2025, 6239.50 (up}
- 4{-4} Subminutte 10/29/2025, 6953.75 (down}
- D{-5} Micro, 3/30/2026, 6353.25 (up}
Reading the chart. Price movements — waves – – in Elliott Wave Theory analysis are labeled with numbers within trending waves and letters with corrective waves. The subscripts — numbers in curly brackets — designate the wave’s degree, which, in Elliott Wave analysis, means the relative position of a wave within the larger and smaller structures that make up the chart. R.N. Elliott, who in the 1930s developed the form of analysis that bears his name, viewed the chart as a complex structure of smaller waves nested within larger waves, which in turn are nested within still larger waves. In mathematics it’s called a fractal structure, where at every scale the pattern is similar to the others.
Learning and other resources. Elliott Wave analysis provides context, not prophecy. As the 20th century semanticist Alfred Korzybski put it in his book Science and Sanity (1933), “The map is not the territory … The only usefulness of a map depends on similarity of structure between the empirical world and the map.” And I would add, in the ever-changing markets, we can judge that similarity of structure only after the fact.
See the menu page Analytical Methods for a rundown on where to go for information on Elliott Wave analysis.
By Tim Bovee, Portland, Oregon, April 15, 2026
Disclaimer
Tim Bovee, Private Trader tracks the analysis and trades of a private trader for his own accounts. Nothing in this blog constitutes a recommendation to buy or sell stocks, options or any other financial instrument. The only purpose of this blog is to provide education and entertainment.
No trader is ever 100 percent successful in his or her trades. Trading in the stock and option markets is risky and uncertain. Each trader must make trading decisions for his or her own account, and take responsibility for the consequences.
All content on Tim Bovee, Private Trader by Timothy K. Bovee is licensed under a Creative Commons Attribution-ShareAlike 4.0 International License.
Based on work at www.timbovee.com

You must be logged in to post a comment.