3:30 p.m. New York time
Half an hour before the closing bell. The S&P 500 futures fell sharply during the session, reaching 7096.75 after peaking overnight at 7183. A rebound then carried the price back into the 7130s, but that rise faded and the decline resumed.
Elliott Wave Theory. The overnight high fell just short of Monday’s peak at 7185.75, and the sharp reversal that followed strongly suggests that rising wave D{-5} has reached its end. If that is the case, then declining wave E{-5} is now underway. Wave E{-5} is expected to be the final subwave of wave 4{-4}, the expanding triangle correction that began on October 29, 2025.
Why “expected to be”? Sometimes a correction takes a complex path, containing two or three corrective patterns within it. So if the encompassing corrective parent wave, 4{-4}, turns out to be complex, we may have some time to go before the 4th-wave correction reaches its end.
In expanding triangles, each subwave moves beyond the price that ended the prior subwave heading in the same direction. In this case, wave C{-5} ended on March 30 at 6353.25. How much beyond that will wave E{-5} decline? No way to tell. If it moves one point — 25 cents — beyond that level, it has fulfilled the requirement of Elliott Wave Theory and can go to rest. Or it can move a significant distance beyond.
Decision Points. A recovery above 7150–7160 would suggest that the decline is not yet firmly established and could lead to further choppy trading. A move above 7185.75 would invalidate the view that wave D{-5} has ended and would point to further upside. On the downside, a break below today’s low at 7096.75 would strengthen the case that wave E{-5} is underway, with further declines likely to follow.
9:35 a.m. New York time
What’s happening now. The S&P 500 E-mini futures continued rising overnight, from a low reached right after Monday’s closing bell, to a high of 7183, attained as Tuesday’s session approached the opening bell. The price then retreated rapidly back into the 7160 and then further, into the 7140s, minutes after the opening bell.
What does it mean? The high is $2.75 below Monday’s peak since wave D{-5} began on March 30. The rising wave remains underway, although it appears to be nearing its end.
Wave D{-5} is a subwave of wave 4{-4}, a downward correction that began on October 29, 2025, and has taken the form of an expanding triangle. In that structure, each subwave, A through E, unfolds in three parts. Wave D{-5} will therefore be followed by declining wave E{-5}, which will carry wave 4{-4} to its conclusion.
Decision Points. A move above 7185.75 would confirm that wave D{-5} continues to rise and allow for further, likely limited, gains. Repeated failure in the 7180–7185 range would suggest that the wave is nearing completion. A decline below 7145–7150 would provide the first indication that wave E{-5} to the downside may be underway, with a break below 7100 offering stronger confirmation that the trend has turned.
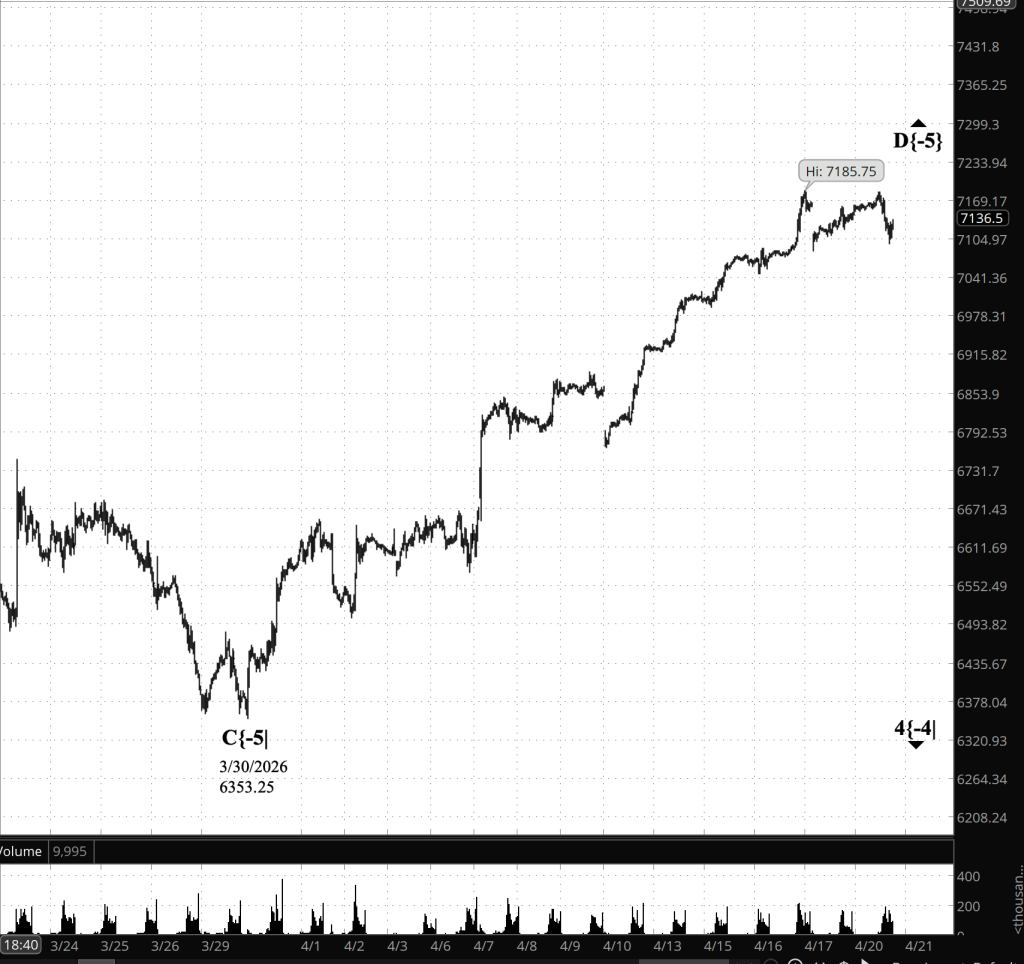
[S&P 500 E-mini futures at 3:30 p.m., 40-minute bars with volume]
Waves Now Underway
These are the waves currently in progress under my principal analysis. Each line on the list shows the wave number, with the subscript in curly brackets, the traditional degree name, the starting date, the starting price of the S&P 500 E-mini futures, and the direction of the wave.
- S&P 500 Index:
- 5{+3} Supercycle, 7/8/1932, 4.40 (up)
- 5{+2} Cycle, 12/9/1974, 60.96 (up)
- 5{+1} Primary, 3/6/2009, 666.79 (up)
- 5{0} Intermediate, 2/11/2016, 1810.10 (up)
- 3{-1} Minor, 3/23/2020, 2191.36 (up)
- 1{-2} Minute, 7/31/2025, 6468.50 (down)
- S&P 500 E-mini futures
- 5{-3} Minuette 8/1/2025, 6239.50 (up}
- 4{-4} Subminutte 10/29/2025, 6953.75 (down}
- D{-5} Micro, 3/30/2026, 6353.25 (up}
Reading the chart. Price movements — waves – – in Elliott Wave Theory analysis are labeled with numbers within trending waves and letters with corrective waves. The subscripts — numbers in curly brackets — designate the wave’s degree, which, in Elliott Wave analysis, means the relative position of a wave within the larger and smaller structures that make up the chart. R.N. Elliott, who in the 1930s developed the form of analysis that bears his name, viewed the chart as a complex structure of smaller waves nested within larger waves, which in turn are nested within still larger waves. In mathematics it’s called a fractal structure, where at every scale the pattern is similar to the others.
Learning and other resources. Elliott Wave analysis provides context, not prophecy. As the 20th century semanticist Alfred Korzybski put it in his book Science and Sanity (1933), “The map is not the territory … The only usefulness of a map depends on similarity of structure between the empirical world and the map.” And I would add, in the ever-changing markets, we can judge that similarity of structure only after the fact.
See the menu page Analytical Methods for a rundown on where to go for information on Elliott Wave analysis.
By Tim Bovee, Portland, Oregon, April 21, 2026
Disclaimer
Tim Bovee, Private Trader tracks the analysis and trades of a private trader for his own accounts. Nothing in this blog constitutes a recommendation to buy or sell stocks, options or any other financial instrument. The only purpose of this blog is to provide education and entertainment.
No trader is ever 100 percent successful in his or her trades. Trading in the stock and option markets is risky and uncertain. Each trader must make trading decisions for his or her own account, and take responsibility for the consequences.
All content on Tim Bovee, Private Trader by Timothy K. Bovee is licensed under a Creative Commons Attribution-ShareAlike 4.0 International License.
Based on work at www.timbovee.com

You must be logged in to post a comment.