3:30 p.m. New York time
Half an hour before the closing bell. The S&P 500 futures reached a session peak of 7166.25. The price fell from that level into the 7140s. Basically, the futures barely budged.
Elliott Wave Theory. Wave D{-5} remains underway. The entire rise reached a peak of 7185.75 on April 17, and today’s high, rounded up to the whole dollar, reached 20 points below that level before pulling back.
I’ve pulled the chart back to the long view, in part to see the size of the recent market movements compared to the entirety of the parent wave 4{-4}, a downward correction that began on October 29, 2025 from 6954.76. In terms of size, the recent drama in the futures have been like the scratching of a cockroach on a large kitchen floor. Noticeable, but without directional clarity for wave D{-5}.
As has been mentioned many times before, wave 4{-4} is taking the form of an expanding triangle, where each wave extends beyond the previous wave in its respective direction.
One trick of the trade in Elliott Wave Theory for understanding the likely endpoints of subwaves in expanding triangles is to connect the start of subwave A and the start of subwave C with a line, and do the same with the end of subwave A and the end of subwave C. Each line continues on, each providing a likely turning point for wave D and E within the expanding triangle. Sometimes the price moves a significant distance beyond the line. Sometimes it comes up short. Most of the time, in my experience, the turn occurs close to the line.
On this chart, the upper line is where the rise of wave D has stalled in the last few days. If wave E takes the same time in its downward journey as wave D took in its rise, the end of wave E and of the wave 4 corrective pattern will occur at around the 6300 level.
Decision Points.
A sustained move above 7185.75 would indicate that wave D{-5} is extending higher and has not yet reached its end.
Failure to break that level, combined with continued hesitation beneath it, keeps open the possibility that wave D{-5} is nearing completion along the upper boundary of the triangle.
On the downside, a break below the recent consolidation range in the 7120–7130 area would be an early indication that the market is resolving lower. A more decisive move below 7090 would begin to confirm that wave E{-5} is underway.
Bottom line: Price is pressing against the upper boundary of the expanding triangle but has not broken through. Until either 7185.75 gives way or downside levels begin to fail, the market remains in a holding pattern at a structurally important location.
9:35 a.m. New York time
What’s happening now. The S&P 500 E-mini futures stair-stepped higher overnight, from a low of 7121.25 shortly after the closing bell on Tuesday to a high of 7157.25.
What does it mean? Elliott Wave Theory places this rise within wave D{-5}, a rising subwave of wave 4{-4}, a larger downtrending correction that began on October 28, 2025. Wave 4{-4} has taken the form of an expanding triangle, with five subwaves labeled A through E, each composed of three smaller waves.
There is, however, a lack of clarity in the current structure. One interpretation is that wave D{-5} ended on April 17 at 7185.75, and that declining wave E{-5} has already begun.
Yet the price action since that high does not convincingly support that view. Compared with the full advance of wave D{-5} from 6353.25, the pullback so far is shallow and tentative. It does not yet resemble the kind of sustained decline that would be expected if wave E{-5} were underway and ultimately headed toward the 6300s or lower.
This creates a conundrum: the wave count allows for the start of E{-5}, but the price behavior does not yet confirm it. As a result, both possibilities remain in play. The market is, for now, moving sideways within that uncertainty.
Decision Points.
- 7185.75 (April 17 high): A sustained move above this level would strongly suggest that wave D{-5} is still in progress and extending higher, invalidating the immediate start of wave E{-5}.
- 7157–7160 area (overnight high): Short-term resistance. Repeated failure here would reinforce the idea of a maturing or exhausted advance.
- 7120–7130 area: Near-term support. A break below this range would signal that the current sideways structure is resolving downward.
- 7090–7100 area: A decisive move below this level would begin to shift the weight of evidence toward wave E{-5} being underway, especially if followed by continued lower lows.
- Bottom line: Price remains range-bound beneath the April 17 high. A break above that high favors continued upside within D{-5}; a sustained move below 7090 would begin to confirm the transition to E{-5}. Until one of those levels gives way, the market is marking time rather than declaring direction.
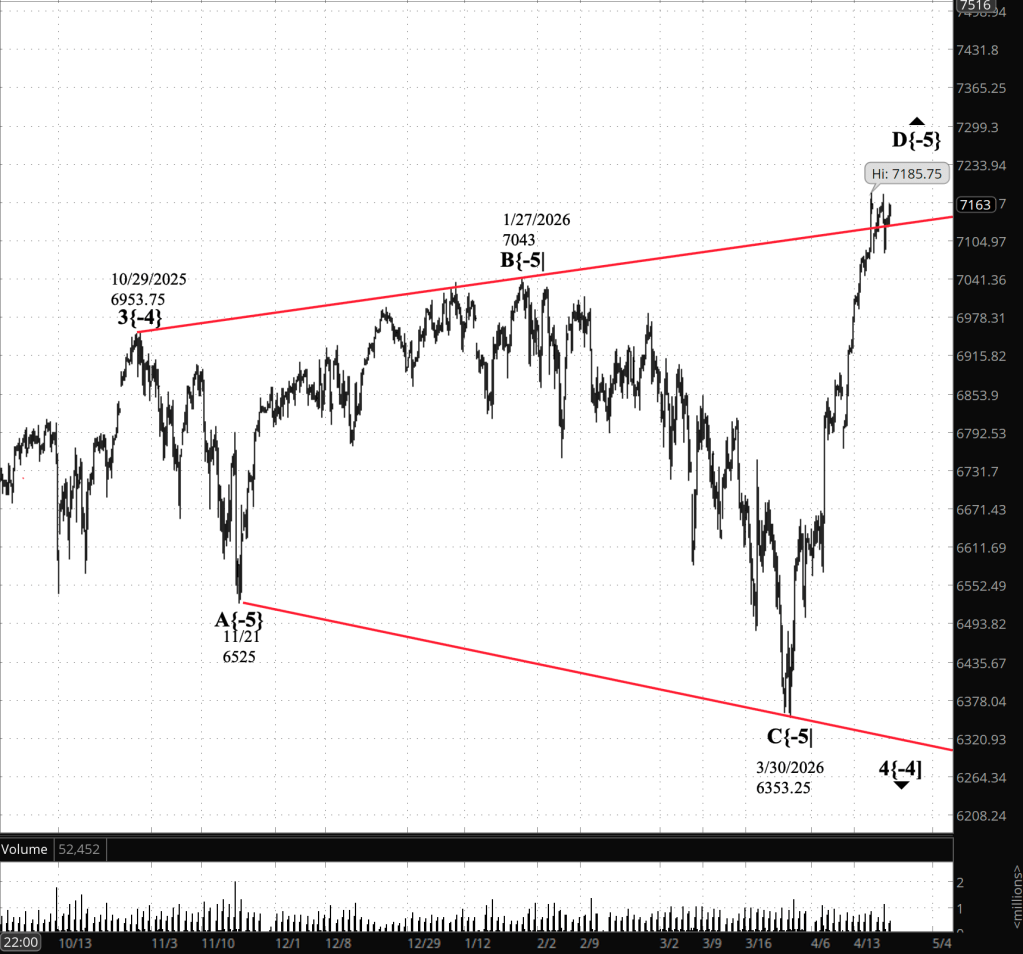
[S&P 500 E-mini futures at 3:30 p.m., 5-hour bars with volume]
Waves Now Underway
These are the waves currently in progress under my principal analysis. Each line on the list shows the wave number, with the subscript in curly brackets, the traditional degree name, the starting date, the starting price of the S&P 500 E-mini futures, and the direction of the wave.
- S&P 500 Index:
- 5{+3} Supercycle, 7/8/1932, 4.40 (up)
- 5{+2} Cycle, 12/9/1974, 60.96 (up)
- 5{+1} Primary, 3/6/2009, 666.79 (up)
- 5{0} Intermediate, 2/11/2016, 1810.10 (up)
- 3{-1} Minor, 3/23/2020, 2191.36 (up)
- 1{-2} Minute, 7/31/2025, 6468.50 (down)
- S&P 500 E-mini futures
- 5{-3} Minuette 8/1/2025, 6239.50 (up}
- 4{-4} Subminutte 10/29/2025, 6953.75 (down}
- D{-5} Micro, 3/30/2026, 6353.25 (up}
Reading the chart. Price movements — waves – – in Elliott Wave Theory analysis are labeled with numbers within trending waves and letters with corrective waves. The subscripts — numbers in curly brackets — designate the wave’s degree, which, in Elliott Wave analysis, means the relative position of a wave within the larger and smaller structures that make up the chart. R.N. Elliott, who in the 1930s developed the form of analysis that bears his name, viewed the chart as a complex structure of smaller waves nested within larger waves, which in turn are nested within still larger waves. In mathematics it’s called a fractal structure, where at every scale the pattern is similar to the others.
Learning and other resources. Elliott Wave analysis provides context, not prophecy. As the 20th century semanticist Alfred Korzybski put it in his book Science and Sanity (1933), “The map is not the territory … The only usefulness of a map depends on similarity of structure between the empirical world and the map.” And I would add, in the ever-changing markets, we can judge that similarity of structure only after the fact.
See the menu page Analytical Methods for a rundown on where to go for information on Elliott Wave analysis.
By Tim Bovee, Portland, Oregon, April 22, 2026
Disclaimer
Tim Bovee, Private Trader tracks the analysis and trades of a private trader for his own accounts. Nothing in this blog constitutes a recommendation to buy or sell stocks, options or any other financial instrument. The only purpose of this blog is to provide education and entertainment.
No trader is ever 100 percent successful in his or her trades. Trading in the stock and option markets is risky and uncertain. Each trader must make trading decisions for his or her own account, and take responsibility for the consequences.
All content on Tim Bovee, Private Trader by Timothy K. Bovee is licensed under a Creative Commons Attribution-ShareAlike 4.0 International License.
Based on work at www.timbovee.com

You must be logged in to post a comment.