3:30 p.m. New York time
Half an hour before the closing bell. In Elliott Wave Theory terms, the S&P 500 futures remain within rising wave D{-5}, pressing once again against the upper boundary of the expanding triangle that began last October.
Over the current session and the four preceding sessions, the price has broken above that boundary several times, only to retreat. The pattern has been one of repeated tests without follow-through, and the market may now be attempting another such breakout.
The question remains unresolved. Will wave D{-5} finally break free of the triangle’s boundary and continue higher? Or, as is more typical of triangles, will it respect that boundary, turn, and begin the next phase, declining wave E{-5}?
Decision Points. The recent highs in the 7180–7186 range mark the key area of resistance at the upper boundary. A sustained move above that zone would argue that wave D{-5} is extending beyond the usual limits of the triangle and that the current count needs to be reconsidered. Failure in that area, followed by a move back below 7120, would support the view that wave D{-5} has ended and that declining wave E{-5} is underway.
9:35 a.m. New York time
What’s happening now. The S&P 500 E-mini futures dithered mainly above the 7120s overnight.
What does it mean? The price is paused at a line connecting the peaks of the uptrending subwave within a falling correction, wave 4{-4}. Elliott Wave Theory finds that such lines connecting the subwave ending and beginning prices offer a rough boundary as the parent wave plays out.
In this case, wave 4{-4} began on October 29, 2025. The upper line connects the starting points of subwaves A{-5} and C{-5}. The lower line connects the ending points of waves A{-5} and C{-5}. At the least, the lines connecting those endpoints tend to be where waves pause in their journeys. Quite often, in my experience, the lines define reversals, where one directional trend changes to another.
So at this point wave D{-5} is paused at the upper line as public mood tries to figure out what all of the public drama of our time really means. If the mood lands on the bullish side, then wave D{-5} continues its rise. If bearish, then it ends, possibly near the upper line, and declining wave E{-5} begins.
When I first began to do daily analyses of the S&P 500 futures, during the Covid-19 Pandemic, an expanding triangle was underway, and I found connecting the prior turning points was a useful way of understanding the future turning points.
And as always, there’s a caveat. Sometimes a price rise or fall breaks free of its seeming restraints, rising well beyond a presumed boundary line. Not often, but it happens.
Decision Points. The upper boundary line, now in the 7165–7190 range depending on the exact touchpoint, is the key level. A sustained move above it would argue that wave D{-5} is extending beyond the usual limits of the triangle and that the current count needs to be reconsidered. Failure at or just below that line, followed by a break back beneath 7125, would favor the view that wave D{-5} has ended and that declining wave E{-5} is underway.
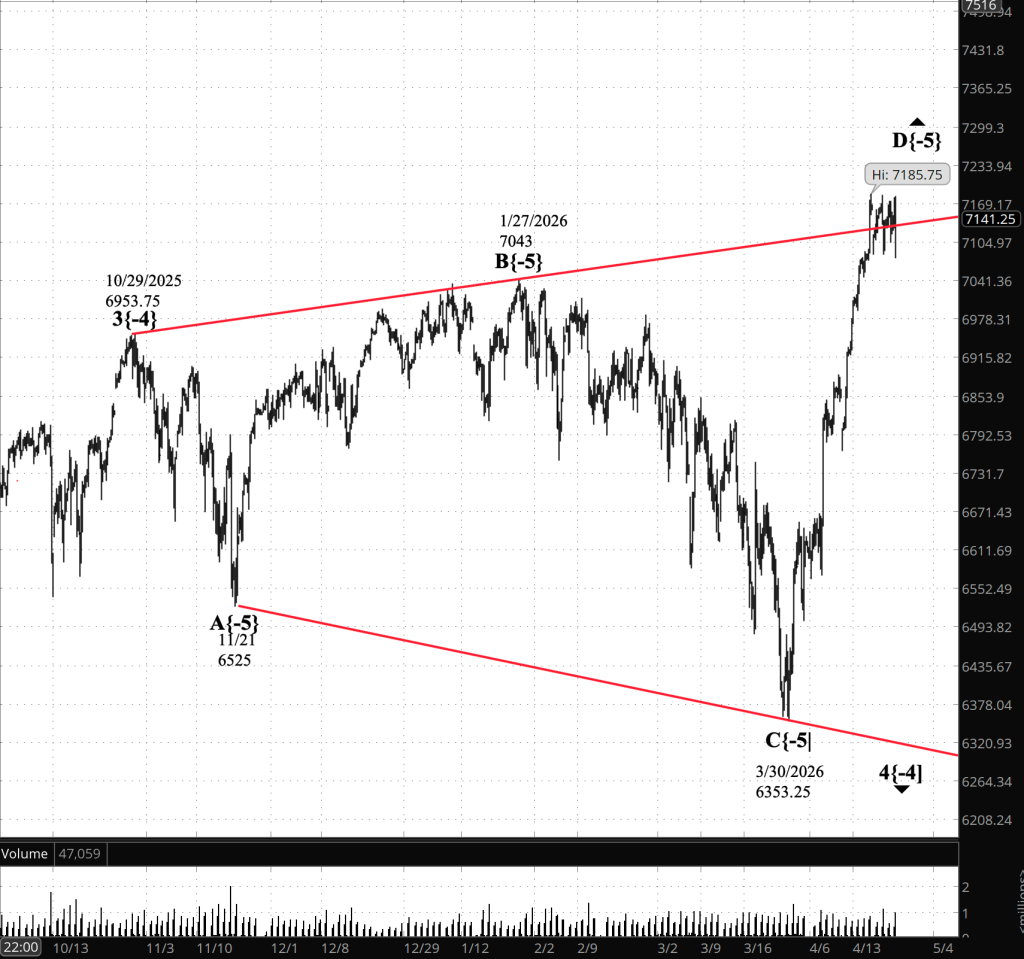
[S&P 500 E-mini futures at 3:30 p.m., 5-hour bars with volume]
Waves Now Underway
These are the waves currently in progress under my principal analysis. Each line on the list shows the wave number, with the subscript in curly brackets, the traditional degree name, the starting date, the starting price of the S&P 500 E-mini futures, and the direction of the wave.
- S&P 500 Index:
- 5{+3} Supercycle, 7/8/1932, 4.40 (up)
- 5{+2} Cycle, 12/9/1974, 60.96 (up)
- 5{+1} Primary, 3/6/2009, 666.79 (up)
- 5{0} Intermediate, 2/11/2016, 1810.10 (up)
- 3{-1} Minor, 3/23/2020, 2191.36 (up)
- 1{-2} Minute, 7/31/2025, 6468.50 (down)
- S&P 500 E-mini futures
- 5{-3} Minuette 8/1/2025, 6239.50 (up}
- 4{-4} Subminutte 10/29/2025, 6953.75 (down}
- D{-5} Micro, 3/30/2026, 6353.25 (up}
Reading the chart. Price movements — waves – – in Elliott Wave Theory analysis are labeled with numbers within trending waves and letters with corrective waves. The subscripts — numbers in curly brackets — designate the wave’s degree, which, in Elliott Wave analysis, means the relative position of a wave within the larger and smaller structures that make up the chart. R.N. Elliott, who in the 1930s developed the form of analysis that bears his name, viewed the chart as a complex structure of smaller waves nested within larger waves, which in turn are nested within still larger waves. In mathematics it’s called a fractal structure, where at every scale the pattern is similar to the others.
Learning and other resources. Elliott Wave analysis provides context, not prophecy. As the 20th century semanticist Alfred Korzybski put it in his book Science and Sanity (1933), “The map is not the territory … The only usefulness of a map depends on similarity of structure between the empirical world and the map.” And I would add, in the ever-changing markets, we can judge that similarity of structure only after the fact.
See the menu page Analytical Methods for a rundown on where to go for information on Elliott Wave analysis.
By Tim Bovee, Portland, Oregon, April 23, 2026
Disclaimer
Tim Bovee, Private Trader tracks the analysis and trades of a private trader for his own accounts. Nothing in this blog constitutes a recommendation to buy or sell stocks, options or any other financial instrument. The only purpose of this blog is to provide education and entertainment.
No trader is ever 100 percent successful in his or her trades. Trading in the stock and option markets is risky and uncertain. Each trader must make trading decisions for his or her own account, and take responsibility for the consequences.
All content on Tim Bovee, Private Trader by Timothy K. Bovee is licensed under a Creative Commons Attribution-ShareAlike 4.0 International License.
Based on work at www.timbovee.com

You must be logged in to post a comment.