3:30 p.m. New York time.
Half an hour before the closing bell. The S&P 500 futures rose during the session to within a dollar of the overnight high, then reversed back into the range that has defined today’s movement.
Elliott Wave Theory. Rising wave D{-5} continues, although it has been stuck in ambiguity since April 16. Is there really more upside remaining to the wave? Or has it played out, stuck in a range until the mass opinion reaches an agreement in favor of decline? If it is decline, then wave D{-5} will have ended at the peak, and declining wave E{-5} will begin. In an expanding triangle, wave E{-5} has a high probability of pushing beyond the endpoint of wave C{-5}, which was also wave D{-5}’s starting point, 6353.25.
The lackadaisical drama is playing out within an uncommon Elliott Wave structure, an expanding triangle, wave 4{-4}, a downward correction that began on October 29, 2025. In expanding triangles, by definition, each subwave moves farther than the previous wave moving in that same direction. The line linking the start of subwave A within wave 4{-4} and the end of wave B{-5}, when extended into future time, marks the likeliest upper boundary of the next rising wave, which is the presently underway wave D{-5}. The future falling wave E{-5} has a similar boundary that is the target for its endpoint — a line connecting the end of wave A{-5} and the end of wave C{-5}.
But what does boundary mean? I think of it as a fence. Not a tall one. A farm fence. The kind of fence you might see while driving down a rural highway, intended to keep the cattle from wandering off. But sometimes an animal makes it over the fence, a bull perhaps, and sometimes a few lazy cows don’t even approach the fence. They’re too busy napping.
And so it is with the boundaries on the chart. The price may move beyond one, as is now happening with wave D{-5}, or it may pull up short, ending before it reaches the boundary.
Decision Points. The decision points from this morning’s analysis remain unchanged. A move above 7208.50 would extend wave D{-5}. Continued trade below that level but above the triangle boundary would keep the market in the present waiting pattern. A decline back below the upper boundary, now roughly in the upper 7160s to low 7170s, would be the first sign that D{-5} may have ended and that declining wave E{-5} may be beginning.
9:35 a.m. New York time
What’s happening now. The S&P 500 futures reached a new high at 7208.50 during the first few hours of overnight trading, then pulled back into the 7180s. Since then, the futures have fluctuated mainly in the 7180s and 7190s.
That keeps the price above the upper boundary of the expanding triangle that began on October 29, 2025.
What does it mean? In Elliott Wave Theory terms, wave D{-5} within the larger wave 4{-4} expanding triangle remains underway. The overnight high extended the D{-5} rise, but the subsequent pullback has so far been shallow enough to leave the count unchanged.
The main question remains whether this is a temporary push beyond the triangle boundary before wave E{-5} begins, or whether the market is separating far enough above the boundary that the present triangle map will need to be reconsidered.
For now, the map still works. The price is above the boundary, but it has not yet moved far enough away from it to make the expanding-triangle interpretation untenable.
Decision Points. A move above 7208.50 would extend wave D{-5} and keep upward pressure in place. Continued trade in the 7180s and 7190s would leave the market in a waiting pattern, still above the triangle boundary but not yet breaking decisively free. A decline back below the upper boundary, now roughly in the upper 7160s to low 7170s, would be the first sign that D{-5} may have ended and that declining wave E{-5} may be beginning.
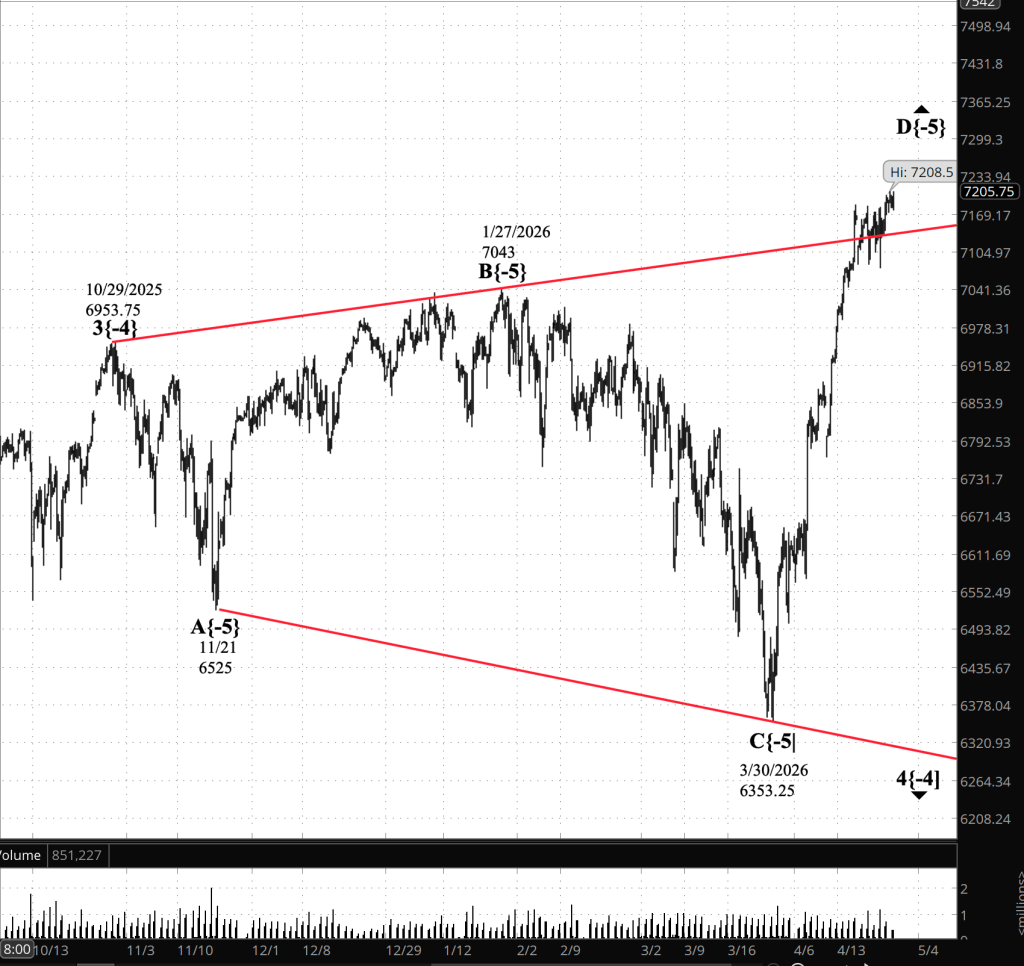
[S&P 500 E-mini futures 3:30 p.m., 5-hour bars with volume]
Waves Now Underway
These are the waves currently in progress under my principal analysis. Each line on the list shows the wave number, with the subscript in curly brackets, the traditional degree name, the starting date, the starting price of the S&P 500 E-mini futures, and the direction of the wave.
- S&P 500 Index:
- 5{+3} Supercycle, 7/8/1932, 4.40 (up)
- 5{+2} Cycle, 12/9/1974, 60.96 (up)
- 5{+1} Primary, 3/6/2009, 666.79 (up)
- 5{0} Intermediate, 2/11/2016, 1810.10 (up)
- 3{-1} Minor, 3/23/2020, 2191.36 (up)
- 1{-2} Minute, 7/31/2025, 6468.50 (down)
- S&P 500 E-mini futures
- 5{-3} Minuette 8/1/2025, 6239.50 (up}
- 4{-4} Subminutte 10/29/2025, 6953.75 (down}
- D{-5} Micro, 3/30/2026, 6353.25 (up}
Reading the chart. Price movements — waves – – in Elliott Wave Theory analysis are labeled with numbers within trending waves and letters with corrective waves. The subscripts — numbers in curly brackets — designate the wave’s degree, which, in Elliott Wave analysis, means the relative position of a wave within the larger and smaller structures that make up the chart. R.N. Elliott, who in the 1930s developed the form of analysis that bears his name, viewed the chart as a complex structure of smaller waves nested within larger waves, which in turn are nested within still larger waves. In mathematics it’s called a fractal structure, where at every scale the pattern is similar to the others.
Learning and other resources. Elliott Wave analysis provides context, not prophecy. As the 20th century semanticist Alfred Korzybski put it in his book Science and Sanity (1933), “The map is not the territory … The only usefulness of a map depends on similarity of structure between the empirical world and the map.” And I would add, in the ever-changing markets, we can judge that similarity of structure only after the fact.
See the menu page Analytical Methods for a rundown on where to go for information on Elliott Wave analysis.
By Tim Bovee, Portland, Oregon, April 27, 2026
Disclaimer
Tim Bovee, Private Trader tracks the analysis and trades of a private trader managing his own accounts. The content reflects my interpretation of market structure, including Elliott Wave Theory and related tools.
Nothing in this blog constitutes a recommendation to buy or sell stocks, options, or any other financial instrument, or to pursue any particular strategy. The purpose of this blog is education and entertainment.
No trader is ever 100 percent successful. Trading in stock and options markets involves risk and uncertainty. Each trader must make decisions for his or her own account and accept full responsibility for the outcomes.
Charts and tools are used to support my personal analysis. Any data displayed is illustrative of that analytical process and is not presented as a source of market data for redistribution.
All content on Tim Bovee, Private Trader by Timothy K. Bovee is licensed under a Creative Commons Attribution-ShareAlike 4.0 International License.
License
Based on work at www.timbovee.com

You must be logged in to post a comment.