3:30 p.m. New York time
Half an hour before the closing bell. The S&P 500 futures continued to decline during the session, reaching a low of 7146.25, and then rising into the 7160s.
Elliott Wave Theory. The price remains above the upper boundary of the Expanding Triangle, the form taken by wave 4{-4}, a downward correction that began last autumn. The corrective wave is in its next-to-the-last subwave, rising wave D{-5}.
Decision Points. No change in the map. The upper boundary of the Expanding Triangle remains the line that matters. So long as the price remains above that boundary, rising wave D{-5} remains technically alive, although today’s decline has kept the question open.
A sustained move below the boundary would increase the likelihood that wave D{-5} ended at 7223.25 and that falling wave E{-5} has begun. A move back above 7185 would weaken that case, and a move above 7223.25 would show that wave D{-5} is still extending.
With the FOMC interest-rate decision due Wednesday, the practical trading conclusion remains unchanged: No new entry until after the release.
9:35 a.m. New York time
What’s happening now. The S&P 500 e-mini futures after yesterday’s closing bell rose to 7223.25 and then began to fall, reaching 7147.50 as today’s opening bell drew near.
What does it mean? The price at the low point remained above the upper boundary of the Expanding Triangle, the form taken by wave 4{-4} when Elliott Wave Theory is applied. The boundary at the low point stood at about 7134.
Wave 4{-4}, a downward correction, began on October 29, 2025, and at this point is well advanced as it works through its fourth subwave, rising wave D{-5}. An Expanding Triangle has five subwaves, and wave D is the fourth.
The triangle boundaries are defined by the highs and lows of prior waves. The boundaries are often the turning points when one subwave ends and the next one begins. Often, but not always. As is often the case in Elliott Wave Theory analysis, the usual pattern taken by a wave is often a suggestion rather than a rule.
If the price remains above the top boundary, I’ll consider wave D{-5} to still be underway. If it falls below the boundary and continues to fall, the likelihood that wave D has ended and falling wave E{-5} is now underway will increase.
Decision Points. The upper boundary of the Expanding Triangle is the key line this morning, standing near 7134 and rising slowly. A decline to the boundary followed by a reversal upward would keep wave D{-5} alive and would suggest that the overnight drop was only another test of support.
A sustained move below the boundary would be the first warning that wave D{-5} may have ended at 7223.25. A continued decline after that break would increase the likelihood that falling wave E{-5} has begun.
On the upside, a move back above 7185 would weaken the bearish case, and a rise above 7223.25 would show that wave D{-5} is still extending. Until one of those tests is resolved, the market remains in the same ambiguity that has defined the structure since mid-April: wave D{-5} may still be pushing higher, but it is doing so at the point where the triangle pattern normally begins to look for a turn.
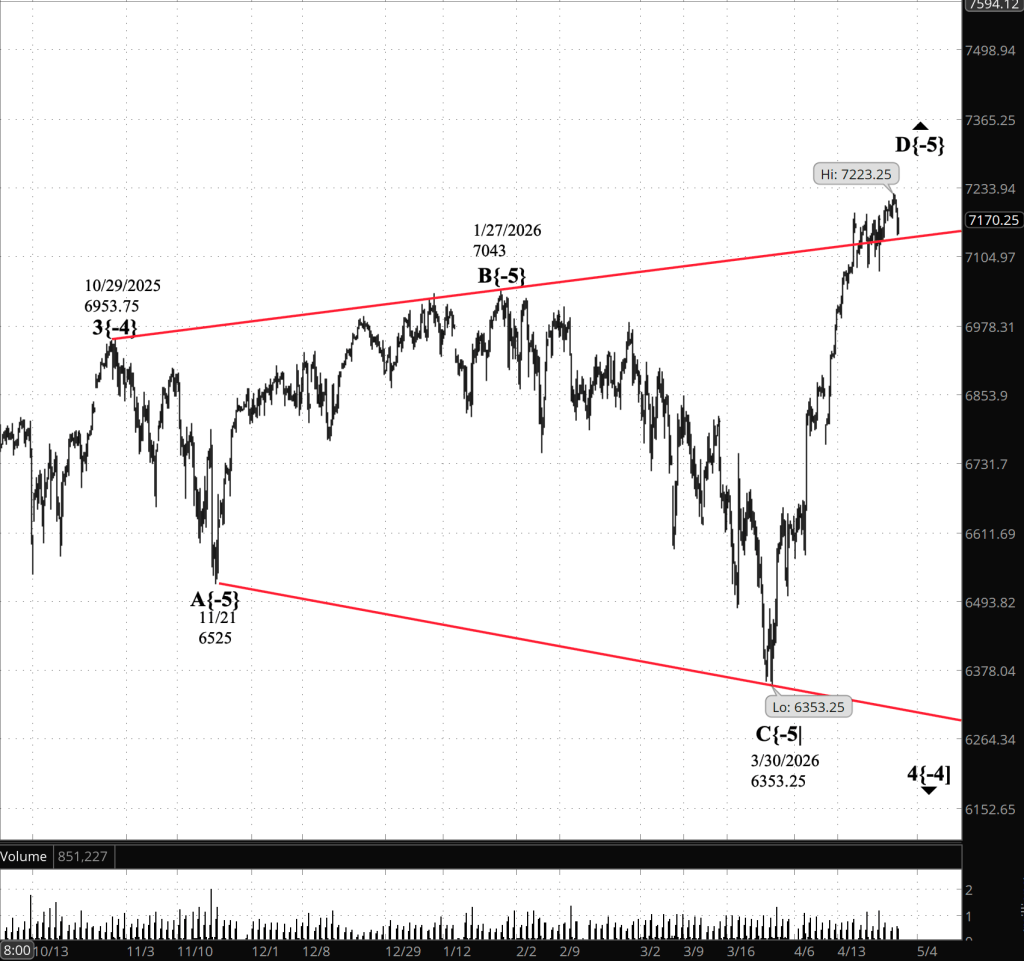
[S&P 500 E-mini futures 3;30 p.m., 5-hour bars with volume]
Waves Now Underway
These are the waves currently in progress under my principal analysis. Each line on the list shows the wave number, with the subscript in curly brackets, the traditional degree name, the starting date, the starting price of the S&P 500 E-mini futures, and the direction of the wave.
- S&P 500 Index:
- 5{+3} Supercycle, 7/8/1932, 4.40 (up)
- 5{+2} Cycle, 12/9/1974, 60.96 (up)
- 5{+1} Primary, 3/6/2009, 666.79 (up)
- 5{0} Intermediate, 2/11/2016, 1810.10 (up)
- 3{-1} Minor, 3/23/2020, 2191.36 (up)
- 1{-2} Minute, 7/31/2025, 6468.50 (down)
- S&P 500 E-mini futures
- 5{-3} Minuette 8/1/2025, 6239.50 (up}
- 4{-4} Subminutte 10/29/2025, 6953.75 (down}
- D{-5} Micro, 3/30/2026, 6353.25 (up}
Reading the chart. Price movements — waves – – in Elliott Wave Theory analysis are labeled with numbers within trending waves and letters with corrective waves. The subscripts — numbers in curly brackets — designate the wave’s degree, which, in Elliott Wave analysis, means the relative position of a wave within the larger and smaller structures that make up the chart. R.N. Elliott, who in the 1930s developed the form of analysis that bears his name, viewed the chart as a complex structure of smaller waves nested within larger waves, which in turn are nested within still larger waves. In mathematics it’s called a fractal structure, where at every scale the pattern is similar to the others.
Learning and other resources. Elliott Wave analysis provides context, not prophecy. As the 20th century semanticist Alfred Korzybski put it in his book Science and Sanity (1933), “The map is not the territory … The only usefulness of a map depends on similarity of structure between the empirical world and the map.” And I would add, in the ever-changing markets, we can judge that similarity of structure only after the fact.
See the menu page Analytical Methods for a rundown on where to go for information on Elliott Wave analysis.
By Tim Bovee, Portland, Oregon, April 28, 2026
Disclaimer
Tim Bovee, Private Trader tracks the analysis and trades of a private trader managing his own accounts. The content reflects my interpretation of market structure, including Elliott Wave Theory and related tools.
Nothing in this blog constitutes a recommendation to buy or sell stocks, options, or any other financial instrument, or to pursue any particular strategy. The purpose of this blog is education and entertainment.
No trader is ever 100 percent successful. Trading in stock and options markets involves risk and uncertainty. Each trader must make decisions for his or her own account and accept full responsibility for the outcomes.
Charts and tools are used to support my personal analysis. Any data displayed is illustrative of that analytical process and is not presented as a source of market data for redistribution.
All content on Tim Bovee, Private Trader by Timothy K. Bovee is licensed under a Creative Commons Attribution-ShareAlike 4.0 International License.
License
Based on work at www.timbovee.com

You must be logged in to post a comment.