3:30 p.m. New York time
Half an hour before the closing bell. The S&P 500 futures peaked at 7300.75 early in the session and then began to fall, so far reaching slightly below 7260.
Elliott Wave Theory. The decline can be counted as five waves. It could be a pullback within wave D{-5}, which has been rising since the end of March, or it could mean that wave D reached its end at today’s peak, and what has followed are the first steps of declining wave E{-5}.
Implications can be read into the movement, but not certainties — not yet.
However, even if wave E{-5} has not yet begun, its time is rushing toward us. Here is an outline of how it will form.
Both waves D{-5} and E{-5} are subwaves of wave 4{-4}, a downward correction that has taken the form of an Expanding Triangle. The “Expanding” part means that each rising wave ends higher than the one before, and declining waves do the same on the low side.
The last declining subwave, wave C{-5}, ended at 6353.25. That is a minimum wave E{-5} endpoint of sorts. Another target is the lower boundary, which is formed by connecting the endpoints of waves A{-5} and C{-5}, and extending the declining line into the future. That boundary line is another, lower level that, a week from now, will be a few points above 6300. The more time it takes to reach that boundary, the lower the boundary will have fallen.
Will the price get there in a week? No one can say, but it seems unlikely to me. Time, as always, will tell.
Decision Points. A rise above 7300.75 would keep wave D{-5} alive and extending. Failure to regain the 7280s-to-7290s, followed by another move below 7260, would strengthen the case that today’s peak ended wave D{-5}. A move below 7246.25 would give stronger evidence that declining wave E{-5} is underway. Until then, the chart remains balanced between late D{-5} and early E{-5}.
9:35 a.m. New York time
What’s happening now. The S&P 500 E-mini futures hit an overnight peak of 7271.50 as the opening bell approached, then fell rapidly to the 7257 area.
What does it mean? Elliott Wave Theory sees the higher high as increasing the odds that wave D{-5} is continuing within wave 4{-4}, a downward correction taking the form of an Expanding Triangle. The price remains above the upper boundary of the triangle for a third day.
Each peak verifies the scenario that wave D{-5} continues. Each pullback implies that D{-5} may have ended at that peak, and that wave E{-5} has begun its fall.
The chart at this point lives in the Land of Maybe.
Decision Points. A move above 7271.50 would strengthen the case that wave D{-5} is still rising. A drop below the 7257 area would be an early warning that the latest thrust has failed, but not yet decisive. A move below 7246.25 would give stronger evidence that wave D{-5} may have ended and that falling wave E{-5} may be underway.
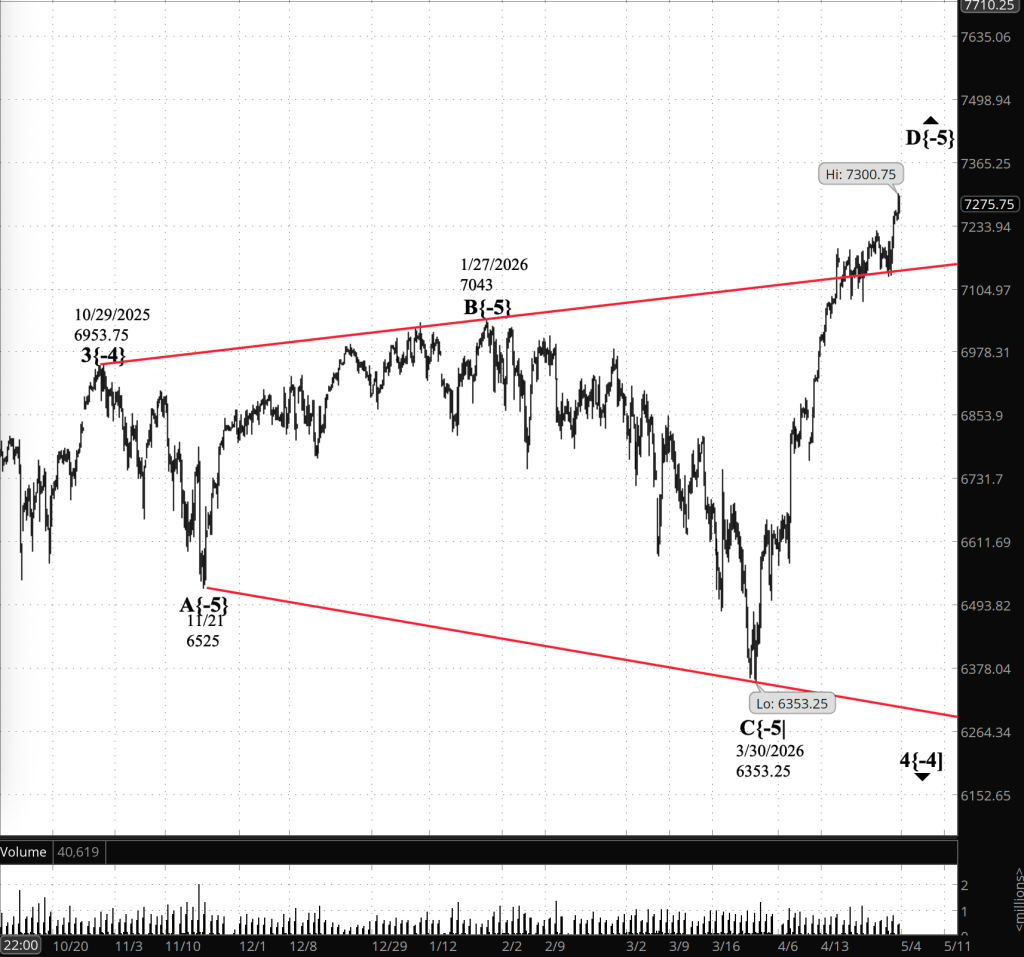
[S&P 500 E-mini futures 3:30 p.m., 5-hour bars with volume]
Waves Now Underway
These are the waves currently in progress under my principal analysis. Each line on the list shows the wave number, with the subscript in curly brackets, the traditional degree name, the starting date, the starting price of the S&P 500 E-mini futures, and the direction of the wave.
- S&P 500 Index:
- 5{+3} Supercycle, 7/8/1932, 4.40 (up)
- 5{+2} Cycle, 12/9/1974, 60.96 (up)
- 5{+1} Primary, 3/6/2009, 666.79 (up)
- 5{0} Intermediate, 2/11/2016, 1810.10 (up)
- 3{-1} Minor, 3/23/2020, 2191.36 (up)
- 1{-2} Minute, 7/31/2025, 6468.50 (down)
- S&P 500 E-mini futures
- 5{-3} Minuette 8/1/2025, 6239.50 (up}
- 4{-4} Subminutte 10/29/2025, 6953.75 (down}
- D{-5} Micro, 3/30/2026, 6353.25 (up}
Reading the chart. Price movements — waves – – in Elliott Wave Theory analysis are labeled with numbers within trending waves and letters with corrective waves. The subscripts — numbers in curly brackets — designate the wave’s degree, which, in Elliott Wave analysis, means the relative position of a wave within the larger and smaller structures that make up the chart. R.N. Elliott, who in the 1930s developed the form of analysis that bears his name, viewed the chart as a complex structure of smaller waves nested within larger waves, which in turn are nested within still larger waves. In mathematics it’s called a fractal structure, where at every scale the pattern is similar to the others.
Learning and other resources. Elliott Wave analysis provides context, not prophecy. As the 20th century semanticist Alfred Korzybski put it in his book Science and Sanity (1933), “The map is not the territory … The only usefulness of a map depends on similarity of structure between the empirical world and the map.” And I would add, in the ever-changing markets, we can judge that similarity of structure only after the fact.
See the menu page Analytical Methods for a rundown on where to go for information on Elliott Wave analysis.
By Tim Bovee, Portland, Oregon, May 1, 2026
Disclaimer
Tim Bovee, Private Trader tracks the analysis and trades of a private trader managing his own accounts. The content reflects my interpretation of market structure, including Elliott Wave Theory and related tools.
Nothing in this blog constitutes a recommendation to buy or sell stocks, options, or any other financial instrument, or to pursue any particular strategy. The purpose of this blog is education and entertainment.
No trader is ever 100 percent successful. Trading in stock and options markets involves risk and uncertainty. Each trader must make decisions for his or her own account and accept full responsibility for the outcomes.
Charts and tools are used to support my personal analysis. Any data displayed is illustrative of that analytical process and is not presented as a source of market data for redistribution.
All content on Tim Bovee, Private Trader by Timothy K. Bovee is licensed under a Creative Commons Attribution-ShareAlike 4.0 International License.
License
Based on work at www.timbovee.com

You must be logged in to post a comment.