3:30 p.m. New York time
Half an hour before the closing bell. The S&P 500 futures continued to rise during the session, reaching the 7240s.
Elliott Wave Theory. The session rise has remained above the upper boundary of the Expanding Triangle, which is the form taken by wave 4{-4}, a downward correction that began last October. The session’s rise from the 7133.75 low now appears to be in its third wave.
The present longer-term rise, wave D{-5}, began on March 30 from 6353.25, so the present session rise within it is quite small compared with the whole. It illustrates that wave D{-5} is still underway, but says nothing about how far that continuing uptrend will continue.
The final subwave within wave 4{-4} still lies in the future.
Decision Points. The morning decision point at 7223.25 has been exceeded, strengthening the case that wave D{-5} is continuing. A sustained move above today’s high would extend that case. A decline back below 7223.25 would weaken the immediate bullish push but would not, by itself, end the D-wave interpretation. The more important warning would be a return to the upper boundary area near 7137. A decisive break below that area would suggest that wave D{-5} may have ended and declining wave E{-5} may have begun.
9:35 a.m. New York time
What’s happening now. The S&P 500 E-mini futures, after dropping to a low of 7131.25 as yesterday’s session neared its end, bounced as overnight trading began, rose slightly above 7200, retreated almost to the prior low, and then bounced again into the 7210s.
What does it mean? The first of the two lows fell slightly below the upper boundary of a large Elliott Wave Theory structure, wave 4{-4}, an Expanding Triangle that began on Oct. 29, 2025. The second low retested that same boundary area. The present smaller wave in progress is the next-to-the-last subwave of that triangle, wave D{-5}.
The upper boundary is formed by a line connecting two peaks in the triangle and then extending that line into the future. The lower boundary connects two lows and extends them. Typically, each peak that follows will encounter resistance when it reaches a boundary.
The dramatic rises and falls overnight look very much like an attempt to break free of the upper boundary. If the attempt succeeds, wave D{-5} continues its rise. If it fails, wave D{-5} ends, and the final subwave within the triangle, declining wave E{-5}, will have begun.
Decision Points. A sustained move above 7223.25, yesterday’s high, would strengthen the case that wave D{-5} is still rising. A decline below 7131.25 would weaken that case and suggest that wave E{-5} may already be underway. Between those levels, the map remains unchanged: wave D{-5} is still the working count, but the futures are testing whether the upper boundary has become support or remains resistance.
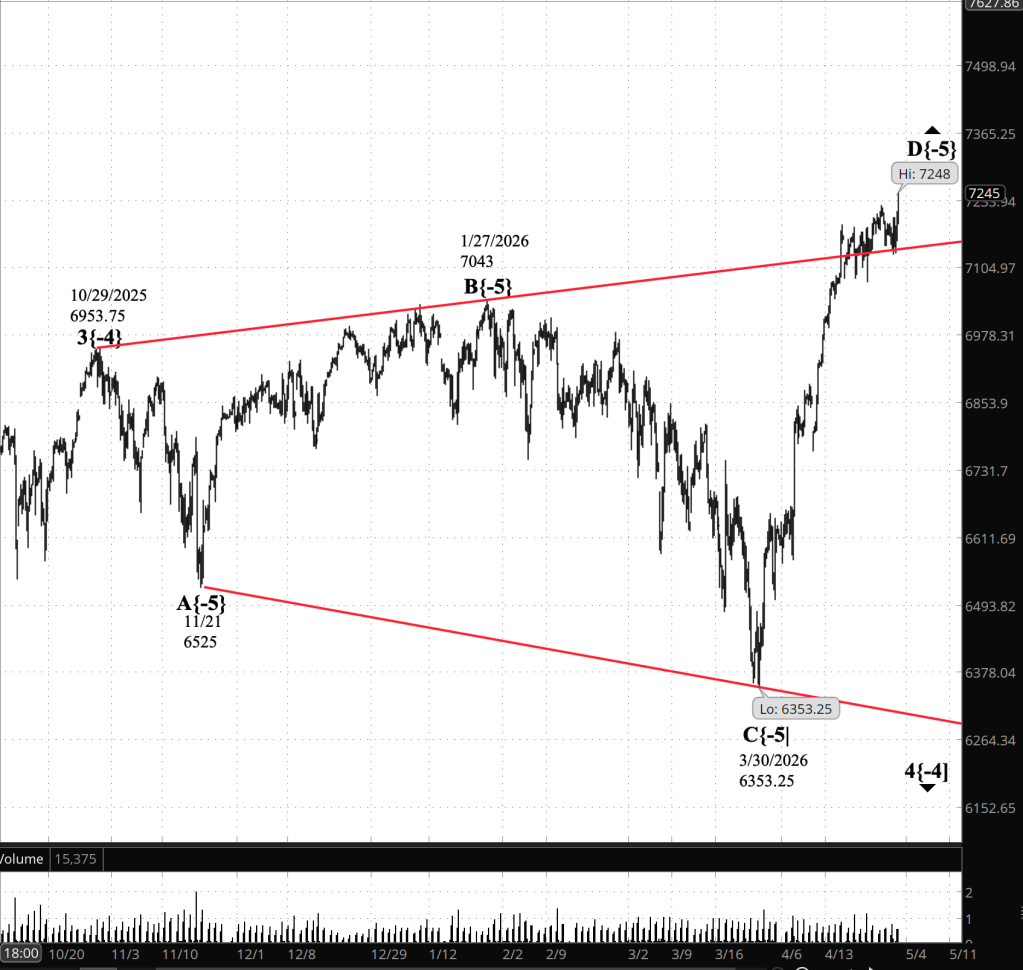
[S&P 500 E-mini futures 3:30 p.m., 5-hour bars with volume]
Waves Now Underway
These are the waves currently in progress under my principal analysis. Each line on the list shows the wave number, with the subscript in curly brackets, the traditional degree name, the starting date, the starting price of the S&P 500 E-mini futures, and the direction of the wave.
- S&P 500 Index:
- 5{+3} Supercycle, 7/8/1932, 4.40 (up)
- 5{+2} Cycle, 12/9/1974, 60.96 (up)
- 5{+1} Primary, 3/6/2009, 666.79 (up)
- 5{0} Intermediate, 2/11/2016, 1810.10 (up)
- 3{-1} Minor, 3/23/2020, 2191.36 (up)
- 1{-2} Minute, 7/31/2025, 6468.50 (down)
- S&P 500 E-mini futures
- 5{-3} Minuette 8/1/2025, 6239.50 (up}
- 4{-4} Subminutte 10/29/2025, 6953.75 (down}
- D{-5} Micro, 3/30/2026, 6353.25 (up}
Reading the chart. Price movements — waves – – in Elliott Wave Theory analysis are labeled with numbers within trending waves and letters with corrective waves. The subscripts — numbers in curly brackets — designate the wave’s degree, which, in Elliott Wave analysis, means the relative position of a wave within the larger and smaller structures that make up the chart. R.N. Elliott, who in the 1930s developed the form of analysis that bears his name, viewed the chart as a complex structure of smaller waves nested within larger waves, which in turn are nested within still larger waves. In mathematics it’s called a fractal structure, where at every scale the pattern is similar to the others.
Learning and other resources. Elliott Wave analysis provides context, not prophecy. As the 20th century semanticist Alfred Korzybski put it in his book Science and Sanity (1933), “The map is not the territory … The only usefulness of a map depends on similarity of structure between the empirical world and the map.” And I would add, in the ever-changing markets, we can judge that similarity of structure only after the fact.
See the menu page Analytical Methods for a rundown on where to go for information on Elliott Wave analysis.
By Tim Bovee, Portland, Oregon, April 30, 2026
Disclaimer
Tim Bovee, Private Trader tracks the analysis and trades of a private trader managing his own accounts. The content reflects my interpretation of market structure, including Elliott Wave Theory and related tools.
Nothing in this blog constitutes a recommendation to buy or sell stocks, options, or any other financial instrument, or to pursue any particular strategy. The purpose of this blog is education and entertainment.
No trader is ever 100 percent successful. Trading in stock and options markets involves risk and uncertainty. Each trader must make decisions for his or her own account and accept full responsibility for the outcomes.
Charts and tools are used to support my personal analysis. Any data displayed is illustrative of that analytical process and is not presented as a source of market data for redistribution.
All content on Tim Bovee, Private Trader by Timothy K. Bovee is licensed under a Creative Commons Attribution-ShareAlike 4.0 International License.
License
Based on work at www.timbovee.com

You must be logged in to post a comment.