3:30 p.m. New York time
Half an hour before the closing bell. After the Federal Open Market Committee announced that it was leaving interest rates unchanged, the S&P 500 futures rapidly fell from the 7160s to 7137.50, and then fluctuated mainly in the 7140s.
Elliott Wave Theory. Notably, the price remained above the upper boundary line of the long-running fourth-wave downward correction that began last autumn and has taken the form of an Expanding Triangle. The present wave within wave 4{-4} is its next-to-the-last subwave, rising wave D{-5}. Given that reality, I shall continue to lean toward seeing the D wave as still underway.
Decision Points. The upper boundary of the Expanding Triangle remains the key line. As long as the price stays above that boundary, rising wave D{-5} can still be counted as incomplete, although today’s post-FOMC decline weakened the case for immediate strength.
A sustained move back above the 7160s would suggest that the decline after the announcement was only a temporary reaction. A move above the overnight high of 7188.50 would strengthen the case that wave D{-5} is still pressing higher. A move above the prior D{-5} high at 7223.25 would be stronger confirmation.
A sustained break below the upper boundary would suggest that wave D{-5} may be ending and that declining wave E{-5} may be preparing to begin. That would not be final proof, but it would mean the map is beginning to change.
9:35 a.m. New York time
What’s happening now. The S&P 500 e-mini futures reached a higher high, 7188.50. early in overnight trading and then worked its way lower in the 7188.50 for much of overnight and then fell to the 7150s as the opening bell sounded. The Federal Open Market Committee’s interest rate announcement will be at 2 p.m., with departing Fed Chair Jerome Powell holding a news conference at 2:30 p.m.
What does it mean? In Elliott Wave Theory, the wave underway is rising wave D{-5}, a subwave of a downward correction, wave 4{-4}, which began on October 30, 2025.
Wave 4 is taking the form of an Expanding Triangle. Such triangles have five subwaves, each composed of three subwaves. An idea of the turning points can be gained by drawing a line connecting the earlier turning points and extending it into the future as upper and lower boundaries of the triangle.
In this case, wave D{-5} has moved above the upper boundary, slightly, and remains there. I interpret that to mean that the D wave might not be complete yet
Decision Points. The first line to watch is the triangle’s upper boundary, presently near the 7160s. As long as the price remains above or very near that line, rising wave D{-5} can still be counted as incomplete, even if the movement is slow and hesitant.
A sustained move above the overnight high of 7188.50 would strengthen the case that wave D{-5} is still pushing higher. A move above the prior D{-5} high at 7223.25 would be stronger confirmation that the wave has not yet completed.
A sustained drop back below the upper boundary would not by itself prove that wave D{-5} is over, but it would weaken the immediate bullish interpretation. Follow-through below the 7140s would raise the possibility that the market is turning away from the boundary and beginning the transition toward declining wave E{-5}.
Because the FOMC announcement comes at 2 p.m. ET, with Jerome Powell’s news conference at 2:30 p.m., the pre-announcement movement should be treated cautiously. The clearest signal may come not from the first reaction, but from whether the price holds above or below the triangle boundary after the announcement and news conference.
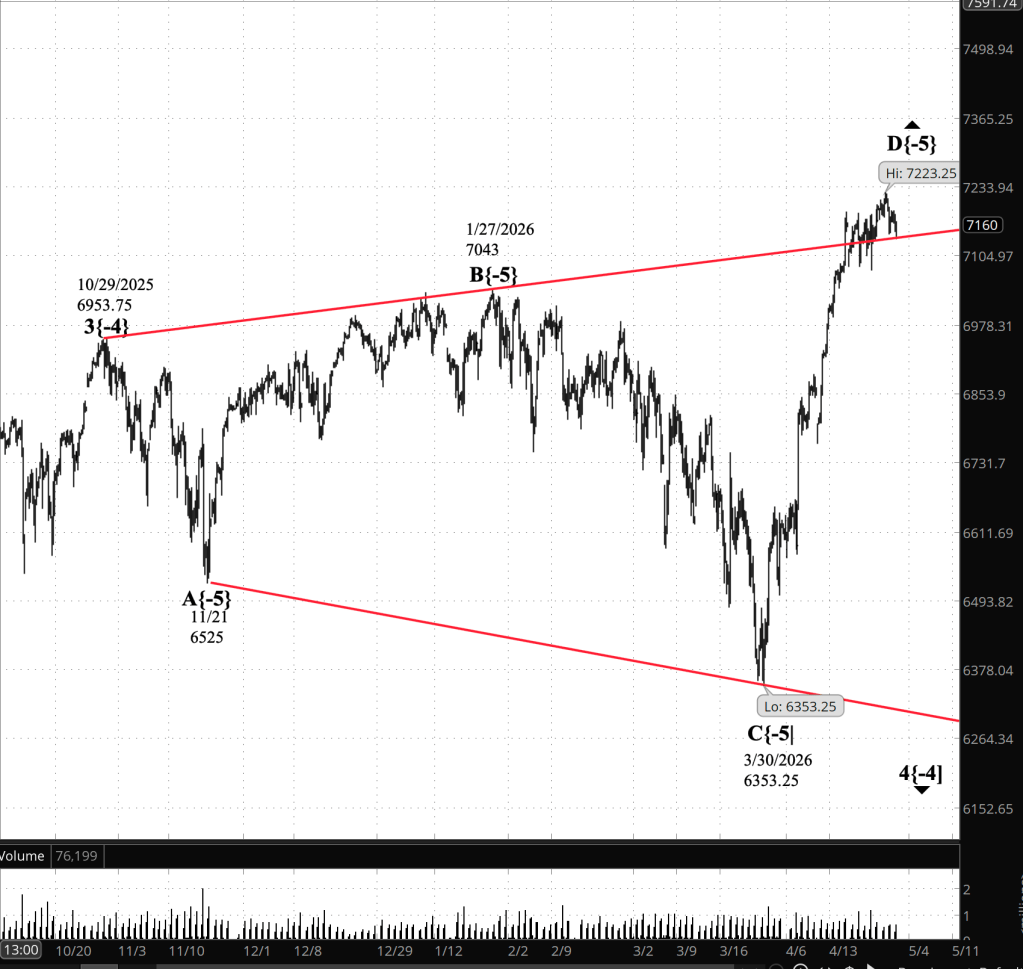
[S&P 500 E-mini futures 3:30 p.m., 5-hour bars with volume]
Waves Now Underway
These are the waves currently in progress under my principal analysis. Each line on the list shows the wave number, with the subscript in curly brackets, the traditional degree name, the starting date, the starting price of the S&P 500 E-mini futures, and the direction of the wave.
- S&P 500 Index:
- 5{+3} Supercycle, 7/8/1932, 4.40 (up)
- 5{+2} Cycle, 12/9/1974, 60.96 (up)
- 5{+1} Primary, 3/6/2009, 666.79 (up)
- 5{0} Intermediate, 2/11/2016, 1810.10 (up)
- 3{-1} Minor, 3/23/2020, 2191.36 (up)
- 1{-2} Minute, 7/31/2025, 6468.50 (down)
- S&P 500 E-mini futures
- 5{-3} Minuette 8/1/2025, 6239.50 (up}
- 4{-4} Subminutte 10/29/2025, 6953.75 (down}
- D{-5} Micro, 3/30/2026, 6353.25 (up}
Reading the chart. Price movements — waves – – in Elliott Wave Theory analysis are labeled with numbers within trending waves and letters with corrective waves. The subscripts — numbers in curly brackets — designate the wave’s degree, which, in Elliott Wave analysis, means the relative position of a wave within the larger and smaller structures that make up the chart. R.N. Elliott, who in the 1930s developed the form of analysis that bears his name, viewed the chart as a complex structure of smaller waves nested within larger waves, which in turn are nested within still larger waves. In mathematics it’s called a fractal structure, where at every scale the pattern is similar to the others.
Learning and other resources. Elliott Wave analysis provides context, not prophecy. As the 20th century semanticist Alfred Korzybski put it in his book Science and Sanity (1933), “The map is not the territory … The only usefulness of a map depends on similarity of structure between the empirical world and the map.” And I would add, in the ever-changing markets, we can judge that similarity of structure only after the fact.
See the menu page Analytical Methods for a rundown on where to go for information on Elliott Wave analysis.
By Tim Bovee, Portland, Oregon, April 29, 2026
Disclaimer
Tim Bovee, Private Trader tracks the analysis and trades of a private trader managing his own accounts. The content reflects my interpretation of market structure, including Elliott Wave Theory and related tools.
Nothing in this blog constitutes a recommendation to buy or sell stocks, options, or any other financial instrument, or to pursue any particular strategy. The purpose of this blog is education and entertainment.
No trader is ever 100 percent successful. Trading in stock and options markets involves risk and uncertainty. Each trader must make decisions for his or her own account and accept full responsibility for the outcomes.
Charts and tools are used to support my personal analysis. Any data displayed is illustrative of that analytical process and is not presented as a source of market data for redistribution.
All content on Tim Bovee, Private Trader by Timothy K. Bovee is licensed under a Creative Commons Attribution-ShareAlike 4.0 International License.
License
Based on work at www.timbovee.com

You must be logged in to post a comment.