3:30 p.m. New York time
Half an hour before the closing bell. The S&P 500 futures continued to rise during the session, moving above this morning’s high of 7412.50 and reaching 7427.75 before pulling back into the 7410s.
Elliott Wave Theory: The move above 7412.50 confirms that rising wave D{-5} continued beyond this morning’s high. The working count is unchanged: Wave D{-5} continues to rise.
Decision Points. A move above 7427.75 would show that wave D{-5} is still extending. A decline below the morning pullback low near 7389 would warn that the latest rise may have ended, but it would still not be enough to confirm falling wave E{-5}. The more meaningful warning level remains 7252, roughly a 15% retracement of the rise from March 30. Until then, the working label remains rising wave D{-5}, with wave E{-5} only a candidate.
9:35 a.m. New York tim
What’s happening now. The S&P 500 E-mini futures rose overnight, reaching a new high, 7412.50, with a small rise after the Employment Situation Report was published. The price then fell to 7389.
What does it mean? The higher high shows that Elliott Wave Theory rising wave D{-5} continued at least into the 7412.50 high. The immediate fall is a reminder that any high potentially is the end of wave D{-5} and the beginning of falling wave E{-5}.
As this apparent end-game plays out, it is important to also realize that the rising wave that began on March 30 may in fact only be the first subwave within wave D{-5}.
At this stage, ambiguity abounds.
All of this is occurring within wave 4{-4}, a downward correction that began on October 29, 2025. Wave 4{-4} has taken the form of an Expanding Triangle, meaning that each wave moves further in its direction than did the earlier wave in that direction — the same for both upwaves and downwaves. The red lines on the chart connect the rising wave endpoints and the lower wave endpoints, projecting into the future likely upper and lower boundaries of the triangle.
At this point, wave D{-5} has moved well beyond the upper boundary.
Decision Points. A move above 7412.50 would show that wave D{-5} is still extending. A continued decline from that high would raise the possibility that wave E{-5} has begun, but the present decline is still far too small to confirm that label. A decline toward 7252 would be the first meaningful warning level, representing roughly a 15% retracement of the rise from March 30. Until then, the safest reading is that wave D{-5} remains the working label, with wave E{-5} only a candidate.
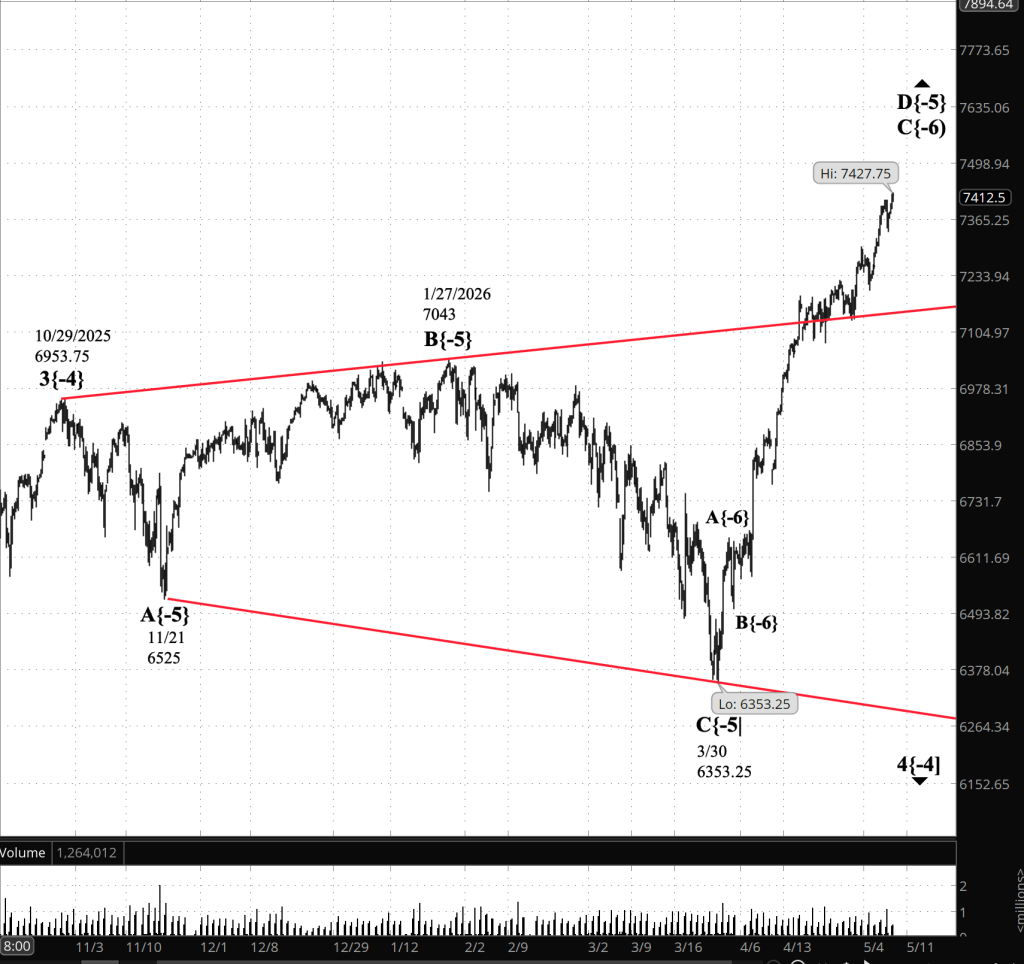
[S&P 500 E-mini futures 3:30 p,m., 5-hour bars with volume]
Waves Now Underway
These are the waves currently in progress under my principal analysis. Each line on the list shows the wave number, with the subscript in curly brackets, the traditional degree name, the starting date, the starting price of the S&P 500 E-mini futures, and the direction of the wave.
- S&P 500 Index:
- 5{+3} Supercycle, 7/8/1932, 4.40 (up)
- 5{+2} Cycle, 12/9/1974, 60.96 (up)
- 5{+1} Primary, 3/6/2009, 666.79 (up)
- 5{0} Intermediate, 2/11/2016, 1810.10 (up)
- 3{-1} Minor, 3/23/2020, 2191.36 (up)
- 1{-2} Minute, 7/31/2025, 6468.50 (down)
- S&P 500 E-mini futures
- 5{-3} Minuette 8/1/2025, 6239.50 (up}
- 4{-4} Subminutte 10/29/2025, 6953.75 (down}
- D{-5} Micro, 3/30/2026, 6353.25 (up}
- C{-6} Submicro, 4/2/2026, 6503.75 (up)
Reading the chart. Price movements — waves – – in Elliott Wave Theory analysis are labeled with numbers within trending waves and letters with corrective waves. The subscripts — numbers in curly brackets — designate the wave’s degree, which, in Elliott Wave analysis, means the relative position of a wave within the larger and smaller structures that make up the chart. R.N. Elliott, who in the 1930s developed the form of analysis that bears his name, viewed the chart as a complex structure of smaller waves nested within larger waves, which in turn are nested within still larger waves. In mathematics it’s called a fractal structure, where at every scale the pattern is similar to the others.
Learning and other resources. Elliott Wave analysis provides context, not prophecy. As the 20th century semanticist Alfred Korzybski put it in his book Science and Sanity (1933), “The map is not the territory … The only usefulness of a map depends on similarity of structure between the empirical world and the map.” And I would add, in the ever-changing markets, we can judge that similarity of structure only after the fact.
See the menu page Analytical Methods for a rundown on where to go for information on Elliott Wave analysis.
By Tim Bovee, Portland, Oregon, May 8, 2026
Disclaimer
Tim Bovee, Private Trader tracks the analysis and trades of a private trader managing his own accounts. The content reflects my interpretation of market structure, including Elliott Wave Theory and related tools.
Nothing in this blog constitutes a recommendation to buy or sell stocks, options, or any other financial instrument, or to pursue any particular strategy. The purpose of this blog is education and entertainment.
No trader is ever 100 percent successful. Trading in stock and options markets involves risk and uncertainty. Each trader must make decisions for his or her own account and accept full responsibility for the outcomes.
Charts and tools are used to support my personal analysis. Any data displayed is illustrative of that analytical process and is not presented as a source of market data for redistribution.
All content on Tim Bovee, Private Trader by Timothy K. Bovee is licensed under a Creative Commons Attribution-ShareAlike 4.0 International License.
License
Based on work at www.timbovee.com

You must be logged in to post a comment.