3:30 p.m. New York time
Half an hour before the closing bell. The S&P 500 futures rose during the session, reaching a new high, 7454.75, in the rise that began on March 30.
Elliott Wave Theory: Wave D{-5} continues to rise, the next-to-last subwave of wave 4{-4}, a downward correction. Today’s new high keeps the D{-5} label intact and confirms that the rise has not yet yielded to declining wave E{-5}.
Decision Points. A continued rise above 7454.75 would further extend wave D{-5}. A decline back below Friday’s 7427.75 high would be the first sign of weakening, but not enough by itself to confirm that wave D{-5} has ended.
A stronger warning would come with a sustained move below 7400, especially if followed by a failed attempt to reclaim that level. The larger confirmation level remains 7252, about a 15% retracement of the rise from 6353.25 to today’s high. A move below that level would shift the working label from “wave D{-5} still rising” to “probable wave E{-5} underway.”
Until then, wave D{-5} remains active, but late-stage and vulnerable, especially with CPI scheduled before Tuesday’s open.
9:35 a.m. New York tim
What’s happening now. The S&P 500 E-mini futures gapped lower when trading resumed on Sunday, following problems with the Iran War negotiations. Overnight, the price remained below Friday’s peak, 7427.75, fluctuating largely between 7400 and 7420, with occasional breakout attempts.
What does it mean? Elliott Wave Theory sees the rise that began on March 30 continuing as it works through its endgame. The rise is an uptrending subwave of wave 4{-4}, a downward correction that began in October 2025 and that has taken the form of an Expanding Triangle.
That form implies several things. 1) The Triangle will have five subwaves. 2) Each subwave will have three smaller subwaves. 3) Each rising subwave within wave 4{-4} will travel higher than the previous rising subwave, and each declining subwave will travel lower.
The present wave is labelled as wave D{-5}, the next-to-the-last subwave within wave 4{-4}. That’s where the ambiguity begins.
The present version of the chart counts wave D{-5} as being in its third and final subwave, wave C{-6}. However, there’s a lack of clarity in the wave structure, and it could be that the rise that began on March 30 is wave A{-6} within wave D{-5}, with a future declining wave B{-6} and rising wave C{-6} still ahead.
In either case, the end of rising wave D{-5}, whether it happens sooner or later, will be followed by declining wave E{-5}, which will carry the price lower than 6353.25, the price from which wave D{-5} began.
The end of wave E{-5}, in the normal course of events, will also be the end of wave 4{-4} and the beginning of rising wave 5{-4}.
Decision Points. A rise above 7427.75 would continue wave D{-5} and keep the immediate upward structure intact. A decline below the overnight low, 7390.50, would be the first sign that the upward push is weakening, but not enough by itself to confirm that wave D{-5} has ended.
A stronger warning would come with a sustained move below 7400, followed by a failure to reclaim that level. The more important confirmation level remains 7252, about a 15% retracement of the rise from 6353.25 to 7427.75. A move below that level would shift the working label from “wave D{-5} still rising” to “probable wave E{-5} underway.”
Until that happens, the map remains: wave D{-5} is still active, but late-stage and vulnerable.
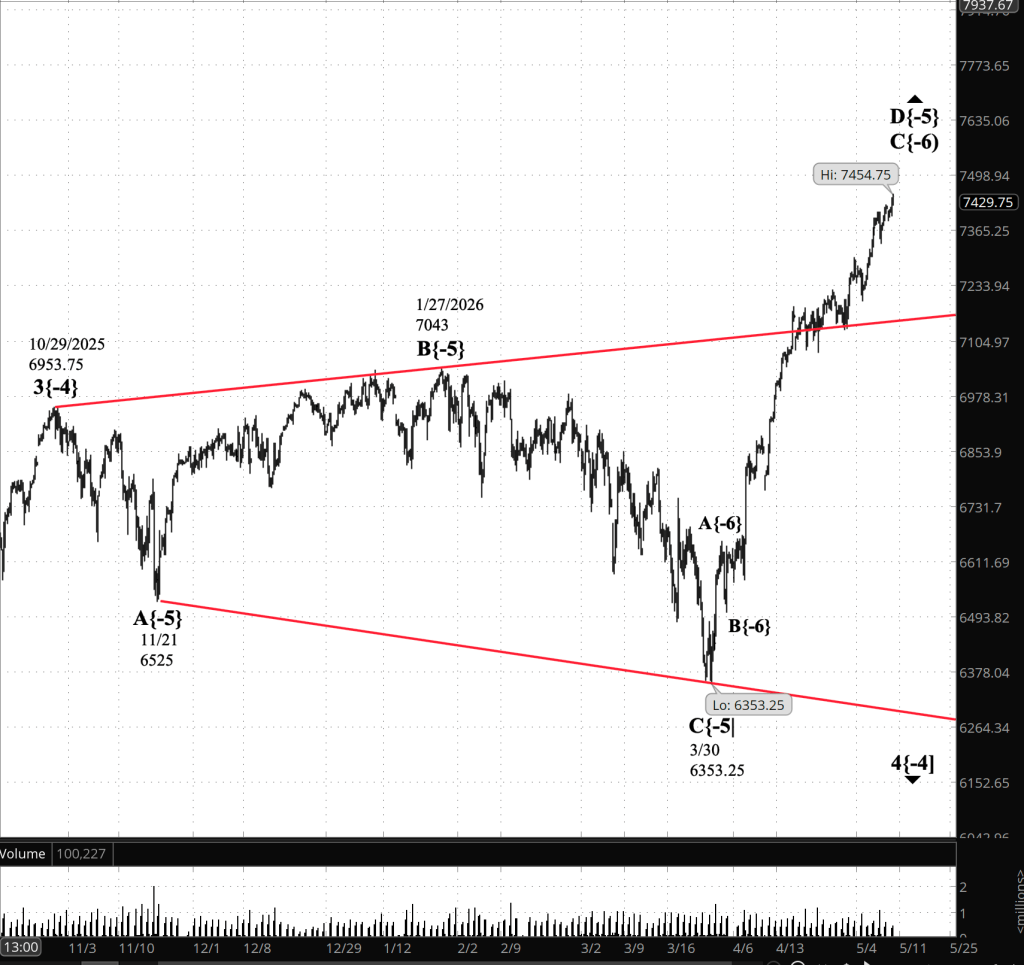
[S&P 500 E-mini futures 3:30 p,m., 5-hour bars with volume]
Waves Now Underway
These are the waves currently in progress under my principal analysis. Each line on the list shows the wave number, with the subscript in curly brackets, the traditional degree name, the starting date, the starting price of the S&P 500 E-mini futures, and the direction of the wave.
- S&P 500 Index:
- 5{+3} Supercycle, 7/8/1932, 4.40 (up)
- 5{+2} Cycle, 12/9/1974, 60.96 (up)
- 5{+1} Primary, 3/6/2009, 666.79 (up)
- 5{0} Intermediate, 2/11/2016, 1810.10 (up)
- 3{-1} Minor, 3/23/2020, 2191.36 (up)
- 1{-2} Minute, 7/31/2025, 6468.50 (down)
- S&P 500 E-mini futures
- 5{-3} Minuette 8/1/2025, 6239.50 (up}
- 4{-4} Subminutte 10/29/2025, 6953.75 (down}
- D{-5} Micro, 3/30/2026, 6353.25 (up}
- C{-6} Submicro, 4/2/2026, 6503.75 (up)
Reading the chart. Price movements — waves – – in Elliott Wave Theory analysis are labeled with numbers within trending waves and letters with corrective waves. The subscripts — numbers in curly brackets — designate the wave’s degree, which, in Elliott Wave analysis, means the relative position of a wave within the larger and smaller structures that make up the chart. R.N. Elliott, who in the 1930s developed the form of analysis that bears his name, viewed the chart as a complex structure of smaller waves nested within larger waves, which in turn are nested within still larger waves. In mathematics it’s called a fractal structure, where at every scale the pattern is similar to the others.
Learning and other resources. Elliott Wave analysis provides context, not prophecy. As the 20th century semanticist Alfred Korzybski put it in his book Science and Sanity (1933), “The map is not the territory … The only usefulness of a map depends on similarity of structure between the empirical world and the map.” And I would add, in the ever-changing markets, we can judge that similarity of structure only after the fact.
See the menu page Analytical Methods for a rundown on where to go for information on Elliott Wave analysis.
By Tim Bovee, Portland, Oregon, May 11, 2026
Disclaimer
Tim Bovee, Private Trader tracks the analysis and trades of a private trader managing his own accounts. The content reflects my interpretation of market structure, including Elliott Wave Theory and related tools.
Nothing in this blog constitutes a recommendation to buy or sell stocks, options, or any other financial instrument, or to pursue any particular strategy. The purpose of this blog is education and entertainment.
No trader is ever 100 percent successful. Trading in stock and options markets involves risk and uncertainty. Each trader must make decisions for his or her own account and accept full responsibility for the outcomes.
Charts and tools are used to support my personal analysis. Any data displayed is illustrative of that analytical process and is not presented as a source of market data for redistribution.
All content on Tim Bovee, Private Trader by Timothy K. Bovee is licensed under a Creative Commons Attribution-ShareAlike 4.0 International License.
License
Based on work at www.timbovee.com

You must be logged in to post a comment.