3:30 p,m. New York time
Half an hour before the closing bell. The S&P 500 futures reached a low for the day, 7420.25, early in the session, 222and thereafter worked their way a bit higher, briefly reaching into the 7470s before pulling back.
Elliott Wave Theory. Rising wave D{-5} continues. The overnight and early-session decline increased the ambiguity, but the price has not yet broken enough structure to require labeling the May 14 high as the end of D{-5} and the start of falling wave E{-5}.
Decision Points. A move above Thursday’s high, 7540, would support the working count that wave D{-5} remains alive and still rising. A move below 7399, the May 13 low, would weaken that view and increase the likelihood that wave E{-5} has begun. A deeper decline toward 7362 — about a 15% retracement of the March 30 to May 14 rise — would provide stronger evidence for the E{-5} interpretation.
For now, the map has not changed. Wave D{-5} remains the working label, while the possibility that E{-5} has already begun remains an available alternate.
9:35 a.m. New York tim
What’s happening now. The S&P 500 E-mini futures fell overnight from yesterday’s close, 7527.75, to a low so far of 7429.75. Context: The low remains above the May 13 low, 7399.
What does it mean? That context supports keeping the current Elliott Wave Theory working count: wave D{-5} remains underway, rising from its March 30 start at 6353.25. That wave is a subwave of wave 4{-4}, a downtrending corrective wave that began on October 29, 2025 from 6953.75.
However, an alternative remains available: March 30 may have ended wave A{-5}, with the current advance forming wave B{-5} of a still-developing Expanding Triangle. The distinction matters because the working count implies a mature D wave awaiting E, while the alternate implies a larger and less mature correction still unfolding.
The rise since March, despite the upward clarity of its energy, carries with it a lot of ambiguity.
Decision Points. A move above yesterday’s high, 7540, would support the working count that wave D{-5} remains alive and still rising. A sustained move below 7399 would weaken that view by breaking the most recent significant low within the advance. A deeper decline toward 7362 — roughly a 15% retracement of the March 30 to May 14 rise — would give stronger evidence that wave E{-5} may have begun.
Even then, certainty would remain limited. In an Expanding Triangle, the map matters, but the terrain rules. The practical question is whether the decline becomes large enough and structured enough to treat the May 14 high as the end of D{-5}. For now, it has not done so.
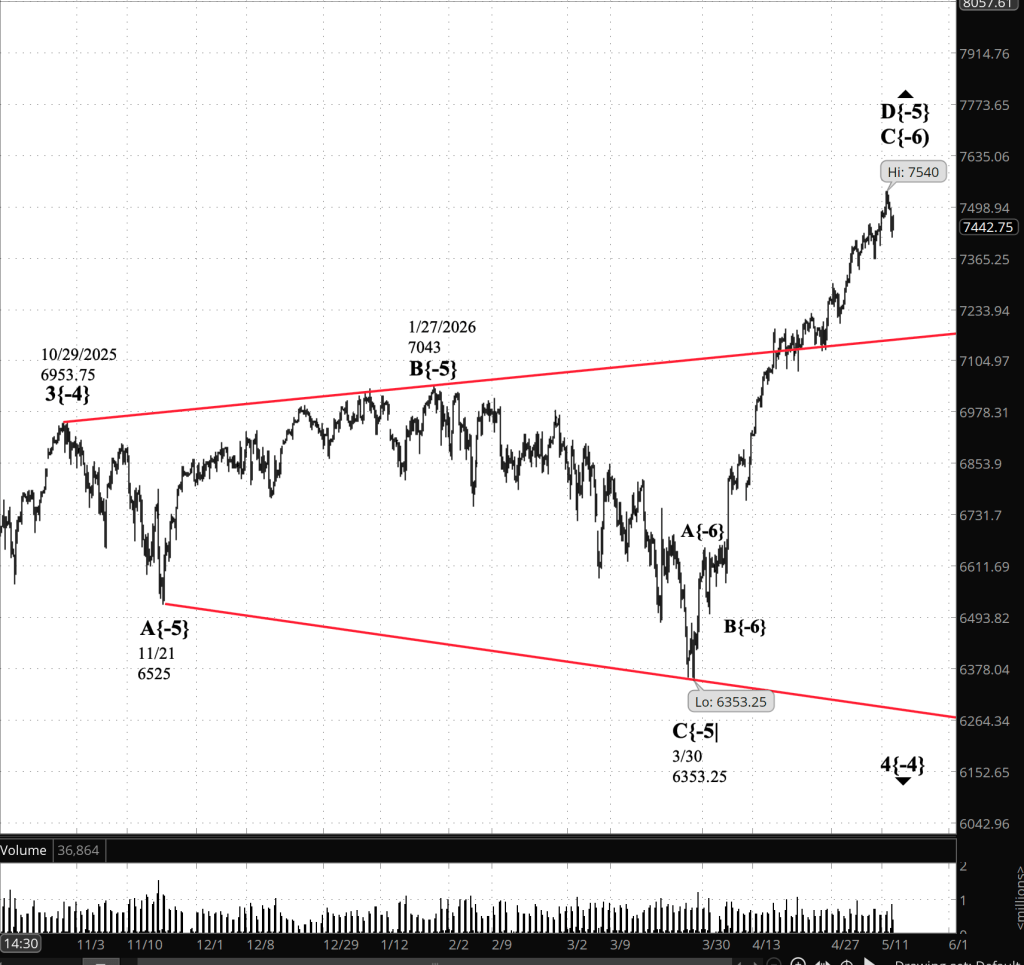
[S&P 500 E-mini futures 3:30 p.m., 330 minute bars with volume]
Waves Now Underway
These are the waves currently in progress under my principal analysis. Each line on the list shows the wave number, with the subscript in curly brackets, the traditional degree name, the starting date, the starting price of the S&P 500 E-mini futures, and the direction of the wave.
- S&P 500 Index:
- 5{+3} Supercycle, 7/8/1932, 4.40 (up)
- 5{+2} Cycle, 12/9/1974, 60.96 (up)
- 5{+1} Primary, 3/6/2009, 666.79 (up)
- 5{0} Intermediate, 2/11/2016, 1810.10 (up)
- 3{-1} Minor, 3/23/2020, 2191.36 (up)
- 1{-2} Minute, 7/31/2025, 6468.50 (down)
- S&P 500 E-mini futures
- 5{-3} Minuette 8/1/2025, 6239.50 (up}
- 4{-4} Subminutte 10/29/2025, 6953.75 (down}
- D{-5} Micro, 3/30/2026, 6353.25 (up}
- C{-6} Submicro, 4/2/2026, 6503.75 (up)
Reading the chart. Price movements — waves – – in Elliott Wave Theory analysis are labeled with numbers within trending waves and letters with corrective waves. The subscripts — numbers in curly brackets — designate the wave’s degree, which, in Elliott Wave analysis, means the relative position of a wave within the larger and smaller structures that make up the chart. R.N. Elliott, who in the 1930s developed the form of analysis that bears his name, viewed the chart as a complex structure of smaller waves nested within larger waves, which in turn are nested within still larger waves. In mathematics it’s called a fractal structure, where at every scale the pattern is similar to the others.
Learning and other resources. Elliott Wave analysis provides context, not prophecy. As the 20th century semanticist Alfred Korzybski put it in his book Science and Sanity (1933), “The map is not the territory … The only usefulness of a map depends on similarity of structure between the empirical world and the map.” And I would add, in the ever-changing markets, we can judge that similarity of structure only after the fact.
See the menu page Analytical Methods for a rundown on where to go for information on Elliott Wave analysis.
By Tim Bovee, Portland, Oregon, May 15, 2026
Disclaimer
Tim Bovee, Private Trader tracks the analysis and trades of a private trader managing his own accounts. The content reflects my interpretation of market structure, including Elliott Wave Theory and related tools.
Nothing in this blog constitutes a recommendation to buy or sell stocks, options, or any other financial instrument, or to pursue any particular strategy. The purpose of this blog is education and entertainment.
No trader is ever 100 percent successful. Trading in stock and options markets involves risk and uncertainty. Each trader must make decisions for his or her own account and accept full responsibility for the outcomes.
Charts and tools are used to support my personal analysis. Any data displayed is illustrative of that analytical process and is not presented as a source of market data for redistribution.
All content on Tim Bovee, Private Trader by Timothy K. Bovee is licensed under a Creative Commons Attribution-ShareAlike 4.0 International License.
License
Based on work at www.timbovee.com

You must be logged in to post a comment.