3:30 p.m. New York time
Half an hour before the closing bell. The S&P 500 futures reached a higher high for the day, 7454.25, early in the session, and then began to fall, so far reaching the 7370s before reclaiming part of the fall.
Elliott Wave Theory: Rising wave D{-5} remains the working count — probably. At this point, every peak is potentially the end of wave D{-5} and the beginning of declining wave E{-5}, after it is confirmed. So far, no end of D{-5} has been confirmed.
Decision Points. The immediate question is whether the decline from 7454.25 is merely another pullback within wave D{-5}, or the early stage of wave E{-5}.
On the downside, the first important level is the overnight low at 7375. A move below that level would increase the likelihood that 7540, the May 14 high, was the end of wave D{-5}. The next stronger marker is near 7362, a 15% retracement of the full wave D{-5} rise from March 30. A sustained move below 7362 would not absolutely prove that wave E{-5} is underway, but it would be the first serious evidence for that interpretation.
On the upside, a recovery back above the 7400s would weaken the immediate E{-5} case. A rise above 7454.25 would show that today’s decline was only another failed attempt to turn the trend. A rise above 7540 would confirm that wave D{-5} is still extending.
For now, the map has not changed, but the terrain is pressing hard against the edge of the map. Wave D{-5} remains the working label, while wave E{-5} has become a live possibility that requires close attention.
9:35 a.m. New York tim
What’s happening now. The S&P 500 E-mini futures reached an overnight low of 7375 shortly after trading resumed, and then began to climb, so far reaching the 7450s. The price remains below the peak of the rise that began on March 30, which is 7540, attained on May 14.
What does it mean? Elliott Wave Theory continues to track wave D{-5} as rising. It began on March 30 from 6353.25.
Wave D{-5} is the next-to-the-last wave within wave 4{-4}, a declining corrective wave that began on October 29, 2025, from 6953.75. The 4th wave has taken the form of an Expanding Triangle, meaning that each peak is higher than the end of the previous rising wave, and each trough is lower than the end of the previous falling wave.
The Expanding Triangle, when complete, will have five subwaves, each containing three subwaves.
One method for reading the progress of an Expanding Triangle is to draw lines connecting the first two peaks and the first two troughs. They act as likely reversal points, a boundary of sorts, but sometimes their role is more that of a pause point before the move continues beyond the boundary. That is what has happened with wave D{-5}.
When will it end? Impossible to say. It appears to be nearing its end, completing wave D{-5} and marking the start of wave E{-5}, but there is no verification that it has done so yet.
Decision Points. A rise above the overnight high, 7453.25, would show that the rebound from 7375 remains active. A rise above 7540 would confirm that wave D{-5} is still extending and that wave E{-5} has not yet begun.
On the downside, a fall below 7375 would renew the possibility that wave D{-5} ended at 7540 and that falling wave E{-5} has begun. The next important level is near 7362, which is a 15% retracement of the entire wave D{-5} rise from March 30. A sustained move below that level would be the first stronger evidence for the E{-5} interpretation.
Even then, the label should be changed cautiously. At this stage, the better reading is: wave D{-5} remains the working count, but the market is now close enough to the top of that wave that any failure below recent lows must be taken seriously.
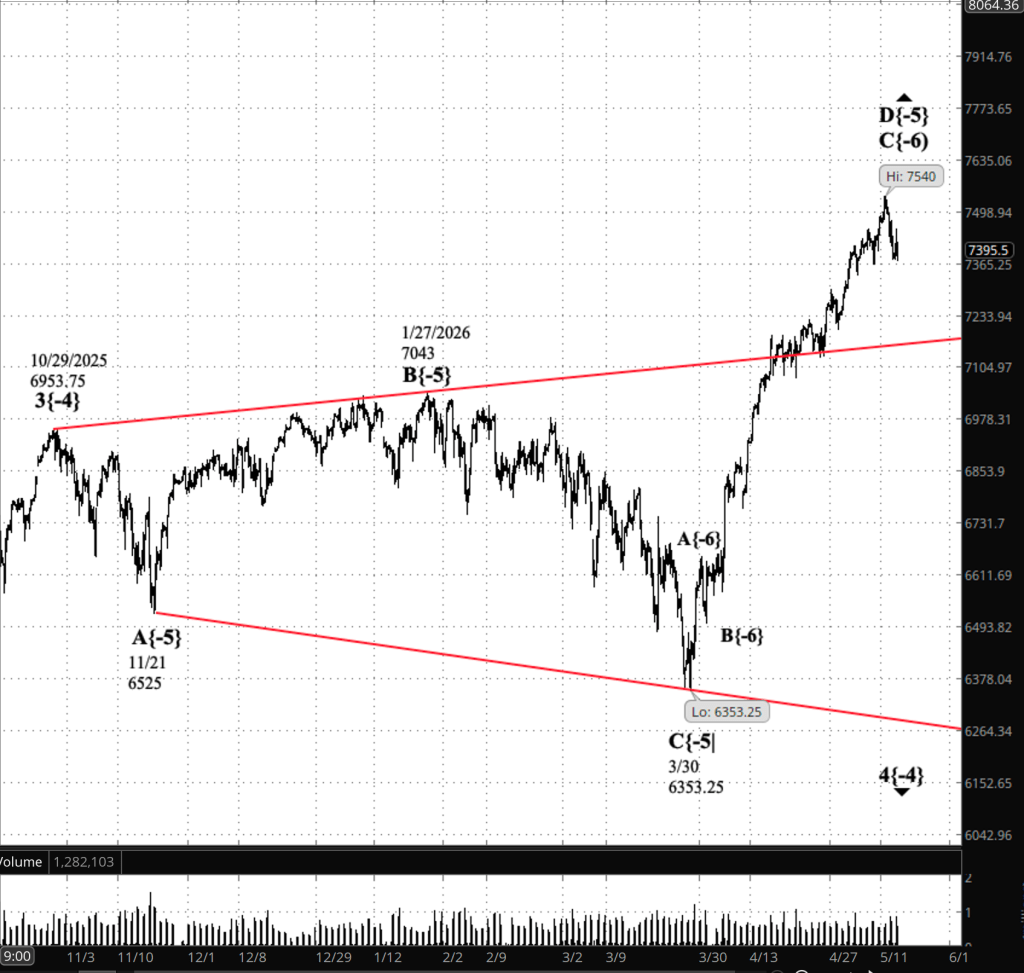
[S&P 500 E-mini futures 3:30 p.m., 330 minute bars with volume]
Waves Now Underway
These are the waves currently in progress under my principal analysis. Each line on the list shows the wave number, with the subscript in curly brackets, the traditional degree name, the starting date, the starting price of the S&P 500 E-mini futures, and the direction of the wave.
- S&P 500 Index:
- 5{+3} Supercycle, 7/8/1932, 4.40 (up)
- 5{+2} Cycle, 12/9/1974, 60.96 (up)
- 5{+1} Primary, 3/6/2009, 666.79 (up)
- 5{0} Intermediate, 2/11/2016, 1810.10 (up)
- 3{-1} Minor, 3/23/2020, 2191.36 (up)
- 1{-2} Minute, 7/31/2025, 6468.50 (down)
- S&P 500 E-mini futures
- 5{-3} Minuette 8/1/2025, 6239.50 (up}
- 4{-4} Subminutte 10/29/2025, 6953.75 (down}
- D{-5} Micro, 3/30/2026, 6353.25 (up}
- C{-6} Submicro, 4/2/2026, 6503.75 (up)
Reading the chart. Price movements — waves – – in Elliott Wave Theory analysis are labeled with numbers within trending waves and letters with corrective waves. The subscripts — numbers in curly brackets — designate the wave’s degree, which, in Elliott Wave analysis, means the relative position of a wave within the larger and smaller structures that make up the chart. R.N. Elliott, who in the 1930s developed the form of analysis that bears his name, viewed the chart as a complex structure of smaller waves nested within larger waves, which in turn are nested within still larger waves. In mathematics it’s called a fractal structure, where at every scale the pattern is similar to the others.
Learning and other resources. Elliott Wave analysis provides context, not prophecy. As the 20th century semanticist Alfred Korzybski put it in his book Science and Sanity (1933), “The map is not the territory … The only usefulness of a map depends on similarity of structure between the empirical world and the map.” And I would add, in the ever-changing markets, we can judge that similarity of structure only after the fact.
See the menu page Analytical Methods for a rundown on where to go for information on Elliott Wave analysis.
By Tim Bovee, Portland, Oregon, May 18, 2026
Disclaimer
Tim Bovee, Private Trader tracks the analysis and trades of a private trader managing his own accounts. The content reflects my interpretation of market structure, including Elliott Wave Theory and related tools.
Nothing in this blog constitutes a recommendation to buy or sell stocks, options, or any other financial instrument, or to pursue any particular strategy. The purpose of this blog is education and entertainment.
No trader is ever 100 percent successful. Trading in stock and options markets involves risk and uncertainty. Each trader must make decisions for his or her own account and accept full responsibility for the outcomes.
Charts and tools are used to support my personal analysis. Any data displayed is illustrative of that analytical process and is not presented as a source of market data for redistribution.
All content on Tim Bovee, Private Trader by Timothy K. Bovee is licensed under a Creative Commons Attribution-ShareAlike 4.0 International License.
License
Based on work at www.timbovee.com

You must be logged in to post a comment.