3:30 p.m. New York time
Half an hour before the closing bell. The S&P 500 futures hit a session low of 7354.25 early on, then rebounded into the 7410s before retreating again.
Elliott Wave Theory. The decline to the 7350s strengthens the argument that downward wave E{-5} may have begun. The rebound into the 7410s weakens that argument somewhat, but the price remains well below the overnight high of 7440.75, which keeps the E{-5} possibility alive.
The session low also moved below the first meaningful retracement test of wave D{-5}, which began March 30 at 6353.25 and peaked May 14 at 7540. That does not confirm wave E{-5}, but it is no longer a trivial pullback.
Nonetheless, wave E{-5} has not yet been confirmed. Until it is, I shall continue to treat upward wave D{-5} as the working count, with a rising probability that it ended May 14.
Decision Points.
A move above today’s rebound high in the 7410s would weaken the immediate bearish case and suggest that the futures are still trying to repair the decline.
A move above 7440.75, the overnight high, would further weaken the case that wave E{-5} has begun.
A move above 7540 would confirm that wave D{-5} remains underway.
A decline below 7354.25 would strengthen the argument that wave E{-5} has begun by producing a new session low after the failed rebound.
A decline into the low 7300s would give the E{-5} count more weight, especially if accompanied by lower highs and lower lows.
A decisive break back below the upper boundary of the Expanding Triangle would be stronger evidence that wave E{-5} is underway.
9:35 a.m. New York tim
What’s happening now. The S&P 500 E-mini futures worked their way lower overnight, falling from 7440.75 into the 7380s.
What does it mean? The working Elliott Wave Theory count still labels upward wave D{-5} as continuing, but with less certainty than before. The wave began on March 30 from 6353.25 and reached a peak of 7540 on May 14, a level that has not yet been challenged.
Bottom line: It is possible, although not yet certain, that wave D{-5} ended on May 14 and that downward wave E{-5} has begun.
Waves D and E are both subwaves of wave 4{-4}, a corrective wave that began last October and has taken the form of an Expanding Triangle. In that structure, each reversal point moves beyond the prior reversal point in the same direction. If the count is correct, wave E{-5} should eventually move below the end of wave C{-5}, 6353.25, and perhaps significantly below that price.
Decision Points.
A rise above 7440.75 would weaken the case that wave E{-5} has begun and would suggest that the overnight decline was only another pullback within still-rising wave D{-5}.
A rise above 7540 would confirm that wave D{-5} remains underway.
A sustained decline below the overnight low near 7380 would strengthen the possibility that wave E{-5} has begun, especially if the futures continue to make lower highs and lower lows during the session.
A deeper decline toward the 7360s would be the first meaningful retracement test of the May 14 peak. A decline below that area would make the E{-5} interpretation more plausible, though not yet fully proven.
A decisive break below the upper boundary of the Expanding Triangle would be far stronger evidence that wave E{-5} is underway.
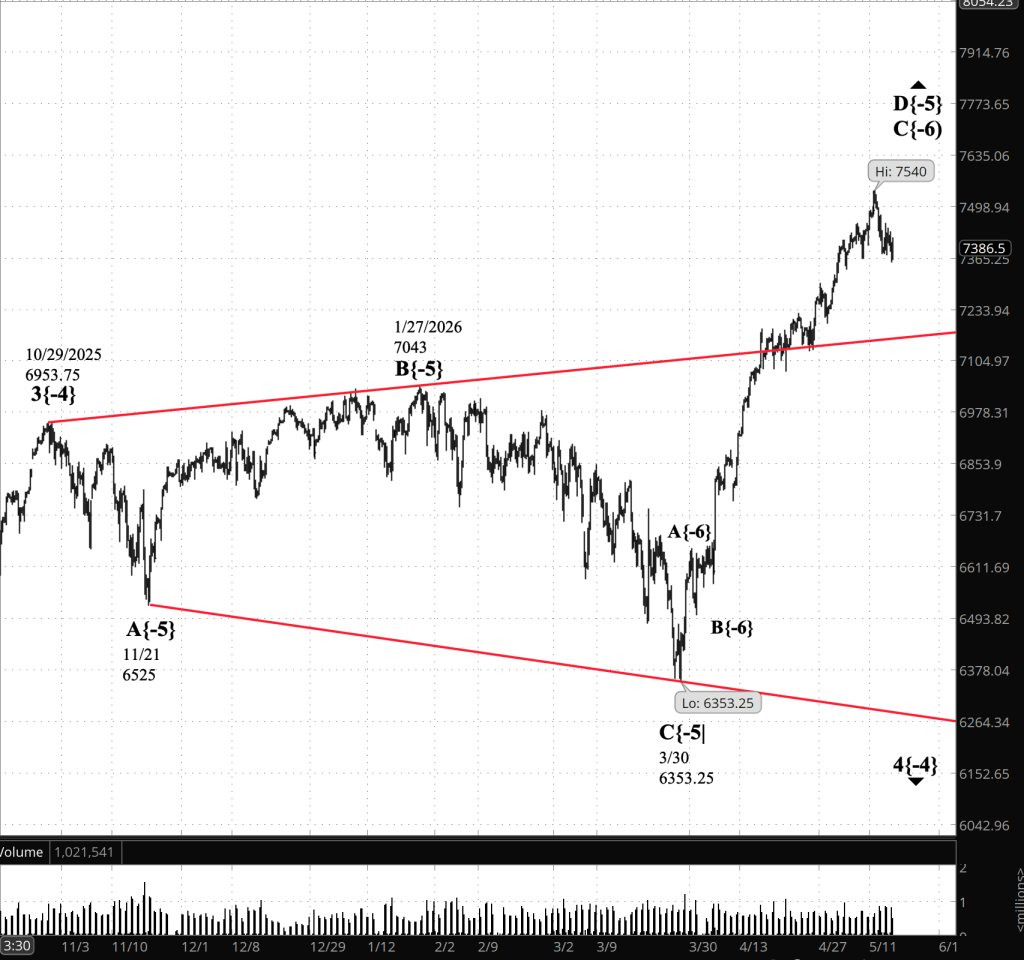
[S&P 500 E-mini futures 3:30 p.m., 330 minute bars with volume]
Waves Now Underway
These are the waves currently in progress under my principal analysis. Each line on the list shows the wave number, with the subscript in curly brackets, the traditional degree name, the starting date, the starting price of the S&P 500 E-mini futures, and the direction of the wave.
- S&P 500 Index:
- 5{+3} Supercycle, 7/8/1932, 4.40 (up)
- 5{+2} Cycle, 12/9/1974, 60.96 (up)
- 5{+1} Primary, 3/6/2009, 666.79 (up)
- 5{0} Intermediate, 2/11/2016, 1810.10 (up)
- 3{-1} Minor, 3/23/2020, 2191.36 (up)
- 1{-2} Minute, 7/31/2025, 6468.50 (down)
- S&P 500 E-mini futures
- 5{-3} Minuette 8/1/2025, 6239.50 (up}
- 4{-4} Subminutte 10/29/2025, 6953.75 (down}
- D{-5} Micro, 3/30/2026, 6353.25 (up}
- C{-6} Submicro, 4/2/2026, 6503.75 (up)
Reading the chart. Price movements — waves – – in Elliott Wave Theory analysis are labeled with numbers within trending waves and letters with corrective waves. The subscripts — numbers in curly brackets — designate the wave’s degree, which, in Elliott Wave analysis, means the relative position of a wave within the larger and smaller structures that make up the chart. R.N. Elliott, who in the 1930s developed the form of analysis that bears his name, viewed the chart as a complex structure of smaller waves nested within larger waves, which in turn are nested within still larger waves. In mathematics it’s called a fractal structure, where at every scale the pattern is similar to the others.
Learning and other resources. Elliott Wave analysis provides context, not prophecy. As the 20th century semanticist Alfred Korzybski put it in his book Science and Sanity (1933), “The map is not the territory … The only usefulness of a map depends on similarity of structure between the empirical world and the map.” And I would add, in the ever-changing markets, we can judge that similarity of structure only after the fact.
See the menu page Analytical Methods for a rundown on where to go for information on Elliott Wave analysis.
By Tim Bovee, Portland, Oregon, May 19, 2026
Disclaimer
Tim Bovee, Private Trader tracks the analysis and trades of a private trader managing his own accounts. The content reflects my interpretation of market structure, including Elliott Wave Theory and related tools.
Nothing in this blog constitutes a recommendation to buy or sell stocks, options, or any other financial instrument, or to pursue any particular strategy. The purpose of this blog is education and entertainment.
No trader is ever 100 percent successful. Trading in stock and options markets involves risk and uncertainty. Each trader must make decisions for his or her own account and accept full responsibility for the outcomes.
Charts and tools are used to support my personal analysis. Any data displayed is illustrative of that analytical process and is not presented as a source of market data for redistribution.
All content on Tim Bovee, Private Trader by Timothy K. Bovee is licensed under a Creative Commons Attribution-ShareAlike 4.0 International License.
License
Based on work at www.timbovee.com

You must be logged in to post a comment.