3:30 p.m. New York time
Half an hour before the closing bell. The S&P 500 futures continued to fall during the session, reaching a low of 7675 and then rebounding to the neighborhood of 7700.
Elliott Wave Theory. The analysis remains unchanged. Falling wave E{-5} continues, as does its initial subwave, falling wave A{-6}. Today’s decline strengthens that interpretation after the ambiguity discussed this morning.
Decision Points. A renewed decline would add evidence that wave A{-6} remains underway. A sustained rise above today’s overnight high of 7739.25 would again raise the possibility that wave A{-6} has ended and rising wave B{-6} has begun.
9:35 a.m. New York time
What’s happening now? The S&P 500 E-mini futures rose overnight, from an early low of 7696 to a high of 7739.25. It then reversed, all of the gain and then some. The price then began to rise as the opening bell drew near.
What does it mean? Elliott Wave Theory continues to conclude that falling wave E{-5} is underway.
Within that wave, the question remains whether falling wave A{-6} continues or whether it has ended and rising wave B{-6} is underway. The overnight rise to 7739.25 was too small to verify the B{-6} scenario, and the subsequent retreat nearly back to its starting point weakened that possibility further. The ambiguity therefore remains unresolved.
Wave E{-5} is the final subwave of wave 4{-4}, a downward correction that began on October 29, 2025 and has taken the form of an expanding triangle. Within that sort of triangle, each rising wave moves higher than the one before, and each falling wave moves lower than its predecessor, allowing boundaries to be drawn that in theory show the endpoints of future waves in each direction.
I say “in theory” because sometimes a wave fails to reach the boundary — a condition called truncation — or overshoots the boundary, as happened with rising wave D{-5}, which ended on August 13. Wave E{-5} began on that date and has yet to reach below the upper boundary. The lower boundary is in the 6130s today and declining every moment.
Decision Points. A sustained rise above 7739.25 would strengthen the case that wave A{-6} has ended and wave B{-6} is underway, although considerably more upside movement would be needed for confirmation. A decline below the overnight low of 7696 would strengthen the alternative that wave A{-6} remains underway. The larger analysis is unchanged either way: Falling wave E{-5} continues, with the declining lower boundary of the expanding triangle still far below the present market.
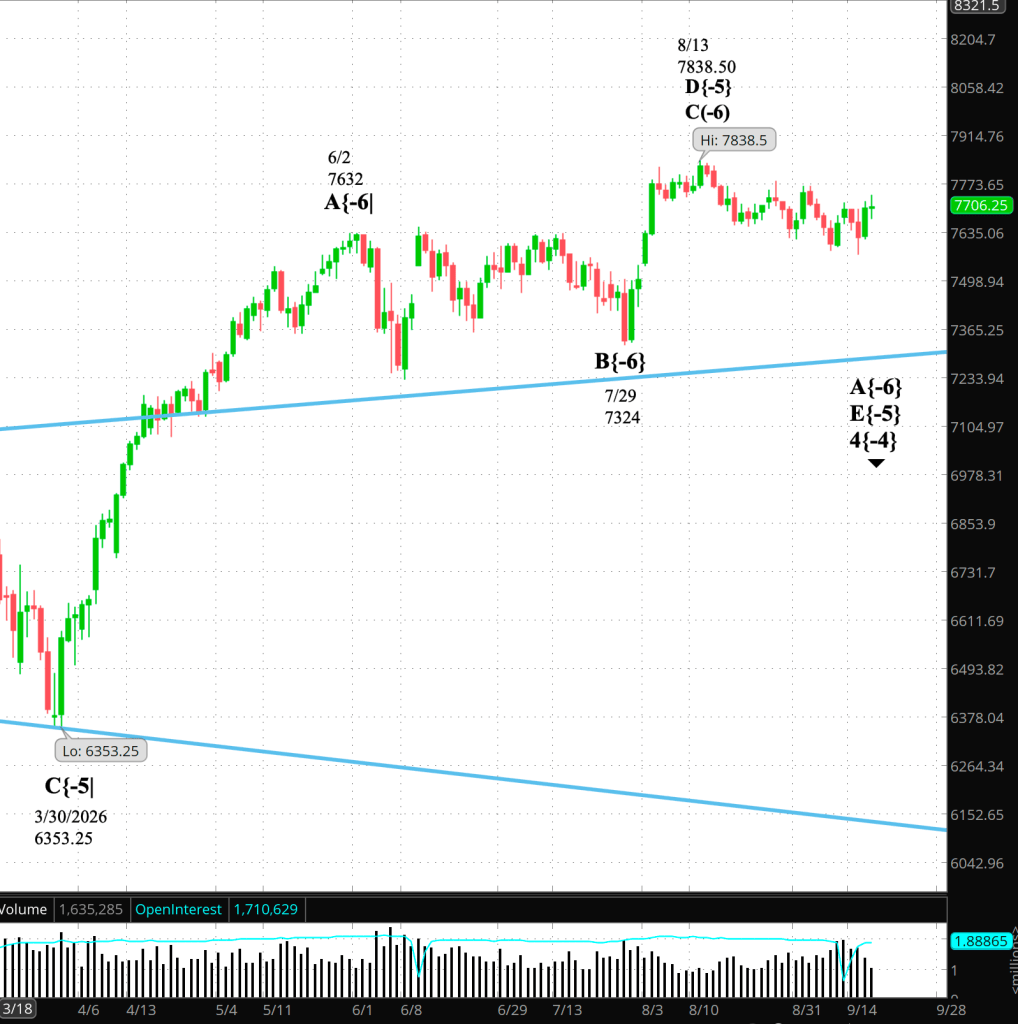
[S&P 500 E-mini futures 3:30 p.m., 1-day bars with volume]
Waves Now Underway
These are the waves currently in progress under my principal analysis. Each line on the list shows the wave number, with the subscript in curly brackets, the traditional degree name, the starting date, the starting price of the S&P 500 E-mini futures, and the direction of the wave.
- S&P 500 Index:
- 5{+3} Supercycle, 7/8/1932, 4.40 (up)
- 5{+2} Cycle, 12/9/1974, 60.96 (up)
- 5{+1} Primary, 3/6/2009, 666.79 (up)
- 5{0} Intermediate, 2/11/2016, 1810.10 (up)
- 3{-1} Minor, 3/23/2020, 2191.36 (up)
- 1{-2} Minute, 7/31/2025, 6468.50 (down)
- S&P 500 E-mini futures
- 5{-3} Minuette 8/1/2025, 6239.50 (up)
- 4{-4} Subminuette 10/29/2025, 6953.75 (down)
- E{-5} Micro, 8/13/2026, 7838.50 (down)
- A{-6} Submicro, 8/13/2026, 7838.50 (down)
Reading the chart. Price movements — waves – – in Elliott Wave Theory analysis are labeled with numbers within trending waves and letters with corrective waves. The subscripts — numbers in curly brackets — designate the wave’s degree, which, in Elliott Wave analysis, means the relative position of a wave within the larger and smaller structures that make up the chart.R.N. Elliott, who in the 1930s developed the form of analysis that bears his name, viewed the chart as a complex structure of smaller waves nested within larger waves, which in turn are nested within still larger waves. In mathematics it’s called a fractal structure, where at every scale the pattern is similar to the others.
Learning and other resources. Elliott Wave analysis provides context, not prophecy. As the 20th century semanticist Alfred Korzybski put it in his book Science and Sanity(1933), “The map is not the territory… The only usefulness of a map depends on similarity of structure between the empirical world and the map.” And I would add, in the ever-changing markets, we can judge that similarity of structure only after the fact.
See the menu pageAnalytical Methods for a rundown on where to go for information on Elliott Wave analysis.
By Tim Bovee, Portland, Oregon, September 18, 2026
Disclaimer
Tim Bovee, Private Trader tracks the analysis and trades of a private trader managing his own accounts. The content reflects my interpretation of market structure, including Elliott Wave Theory and related tools.
Nothing in this blog constitutes a recommendation to buy or sell stocks, options, or any other financial instrument, or to pursue any particular strategy. The purpose of this blog is education and entertainment.
No trader is ever 100 percent successful. Trading in stock and options markets involves risk and uncertainty. Each trader must make decisions for his or her own account and accept full responsibility for the outcomes.
Charts and tools are used to support my personal analysis. Any data displayed is illustrative of that analytical process and is not presented as a source of market data for redistribution.
All content on Tim Bovee, Private Trader byTimothy K. Boveeis licensed under a Creative Commons Attribution-ShareAlike 4.0 International License.
License
Based on work atwww.timbovee.com


You must be logged in to post a comment.