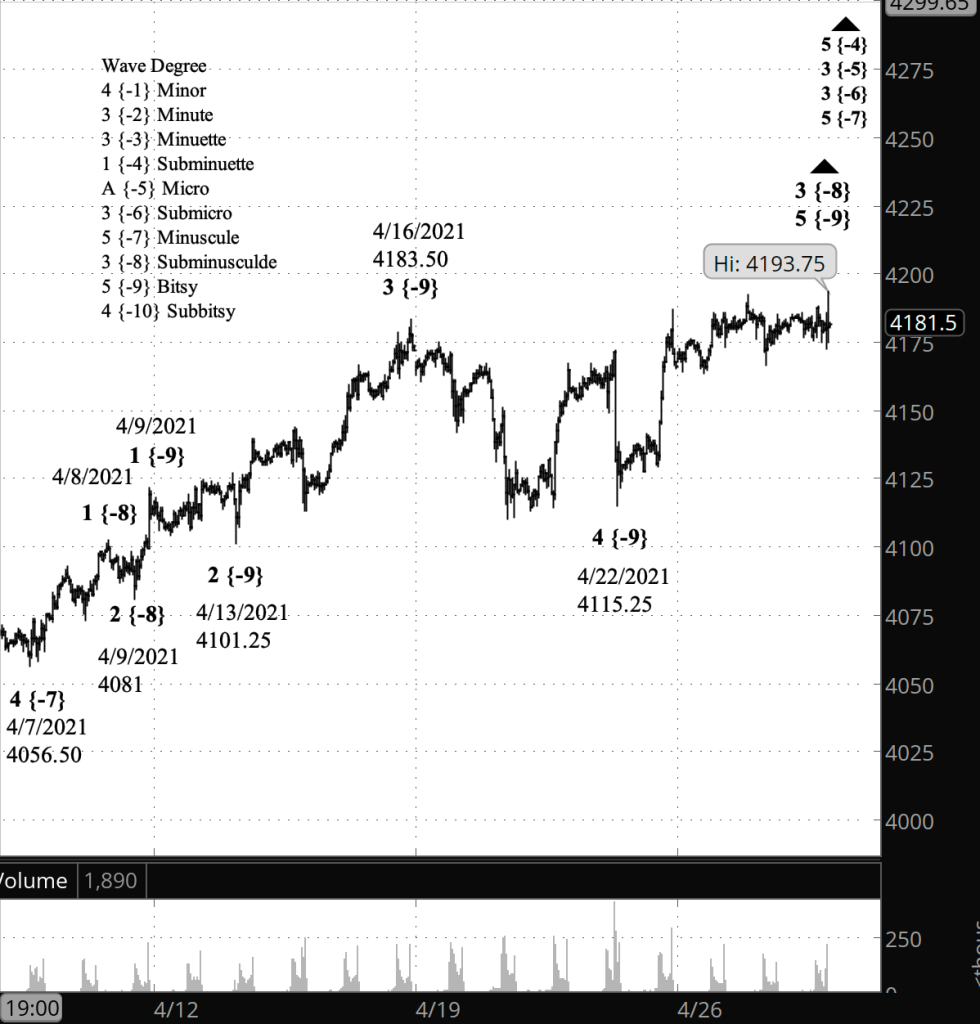
45 minutes before the closing bell. The S&P 500 rose to a new high, 4192.50 on the futures and 4201.53 on the index, meaning that the uptrend that began on April 22 is still underway. In terms of Elliott wave analysis, the rise is wave 5 of Bitsy degree within wave 3 of Subminuscule degee. I’ve updated the chart.
9:45 a.m. New York time
What’s happening now? The S&P 500 remained below yesterday’s peak, 4192.50, in overnight trading.
What does it mean? Two possibilities: Either 4192.50 completes the rise that began April 22 from 4115.25…
What’s the alternative? … or the meandering since yesterday is a correction, with fresh highs yet to come within a few days. It’s impossible to choose between the two. I’ve marked the chart to show the rise is complete, but I have little confidence in that choice.
[S&P 500 E-mini futures at 3:15 p.m., 45-minute bars, with volume]
What does Elliott wave theory say? The rise since April 22 is wave 5 of Bitsy degree. It’s completion will also mark the end of wave 3 of Subminuscule degree, which will be followed by a sideways correction. Subminuscule 3 began on April 8.
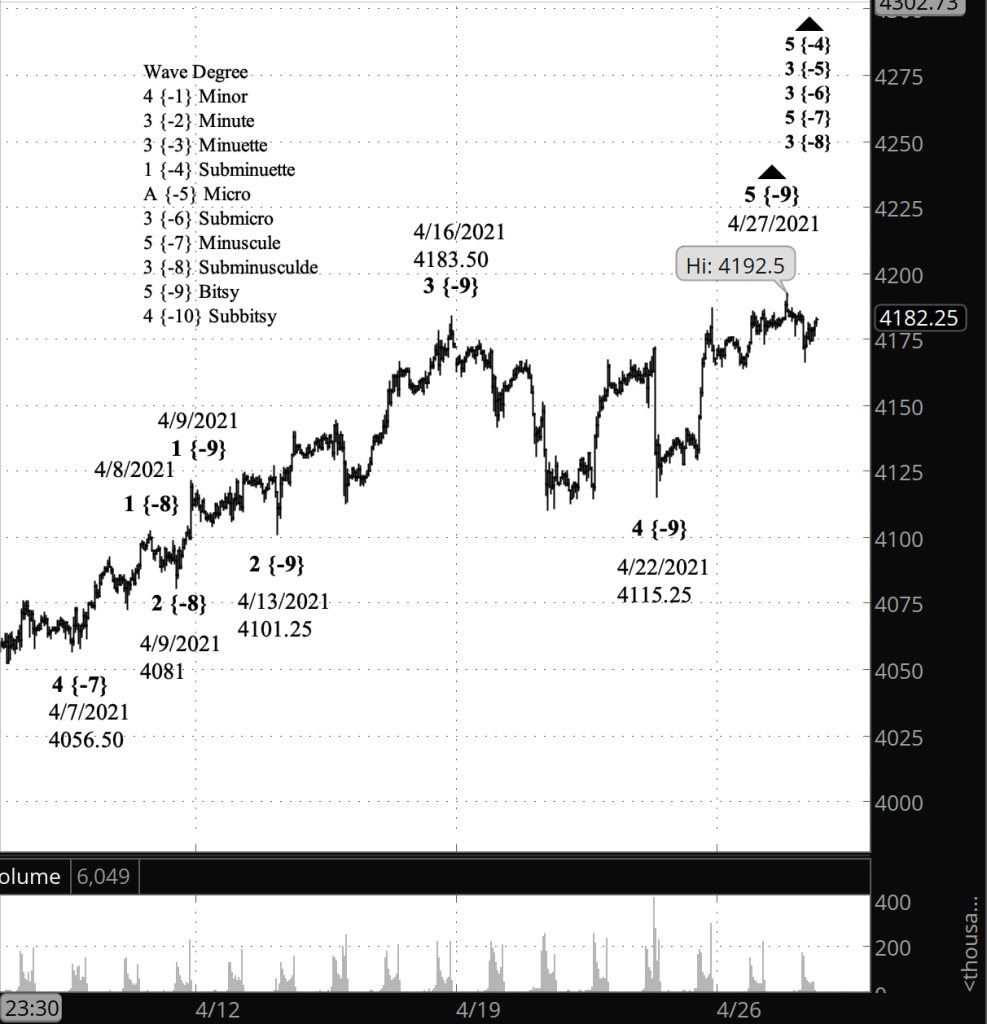
Half an hour before the closing bell. The S&P 500 dropped slightly from overnight high and then rose a little, in what is either a continuation of wave 5 of Bitsy degree to the upside or the early steps in a wave 4 correction of Subminuscule degree, one step larger than Bitsy. I’ve updated the chart.
9:40 a.m. New York time
What’s happening now? The S&P 500 E-mini futures reached a new high in overnight trading, 4192.50. I count that rise as part of the final leg of the uptrend that began April 22.
What does it mean? Completion of that uptrend will be followed by a shallow correction at a larger degree, the uptrend that began April 9.
What’s the alternative? It’s possible that the present high marks the end of the April 22 uptrend.
[S&P 500 E-mini futures at 3:30 p.m., 45-minute bars, with volume]
What does Elliott wave theory say? By my count, the price is in the 5th wave of Subbitsy degree within wave 5 of Bitsy degree within wave 3 of Subminuscule degree.
My trades. Today begins the entry period for positions using options that expire on June 21. The period extends to May 11, with May 4 being the midpoint. I’ll be aiming for a May 4 entry, assuming I can find a prospect with sufficiently high implied volatility that allows me to avoid an earnings announcement.
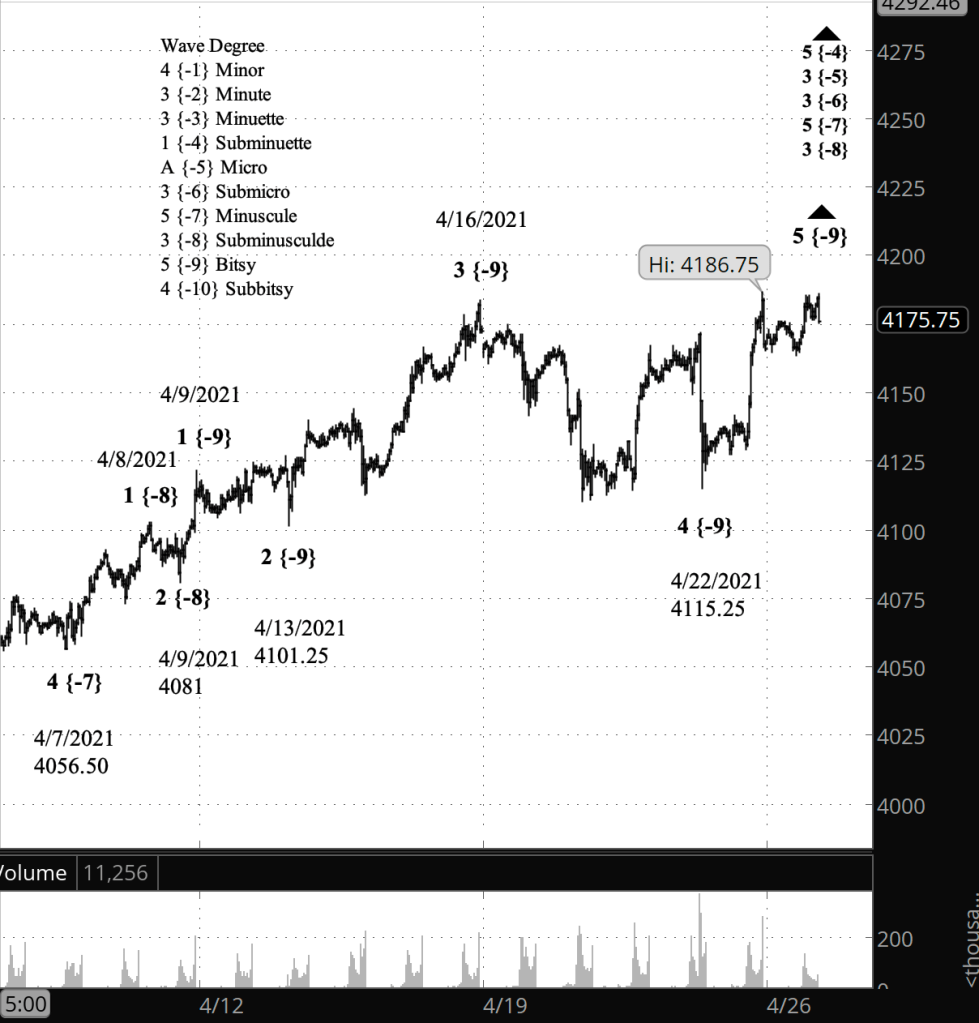
Half an hour before the closing bell. The S&P 500 has been trading in a narrow range today, leaving Friday’s high, 4186.75, intact so far, although the price is only around 3 points below that level. I’ve updated the chart below.
9:50 a.m. New York time
What’s happening now? The S&P 500 E-mini futures, in overnight trading, remained below Friday’s high of 4186.75.
What does it mean? The rise that began April 22 has completed its middle leg, and is now in a correction that will be followed by a rise to a new high.
[S&P 500 E-mini futures at 3:30 p.m., 40-minute bars, with volume]
What does Elliott wave theory say? The rise that began April 22 is wave 5 of Bitsy degree, and within it, at Subbitsy degree, the price has completed its 3rd wave and is now in a 4th wave correction, which will be followed by a 5th wave rise to new highs.
The end of Bitsy wave 5 will mark the end of its parent wave, Subminuscule wave 3, which began on April 9. The completion will be followed by shallow 4th wave correction at Subminuscule degree.
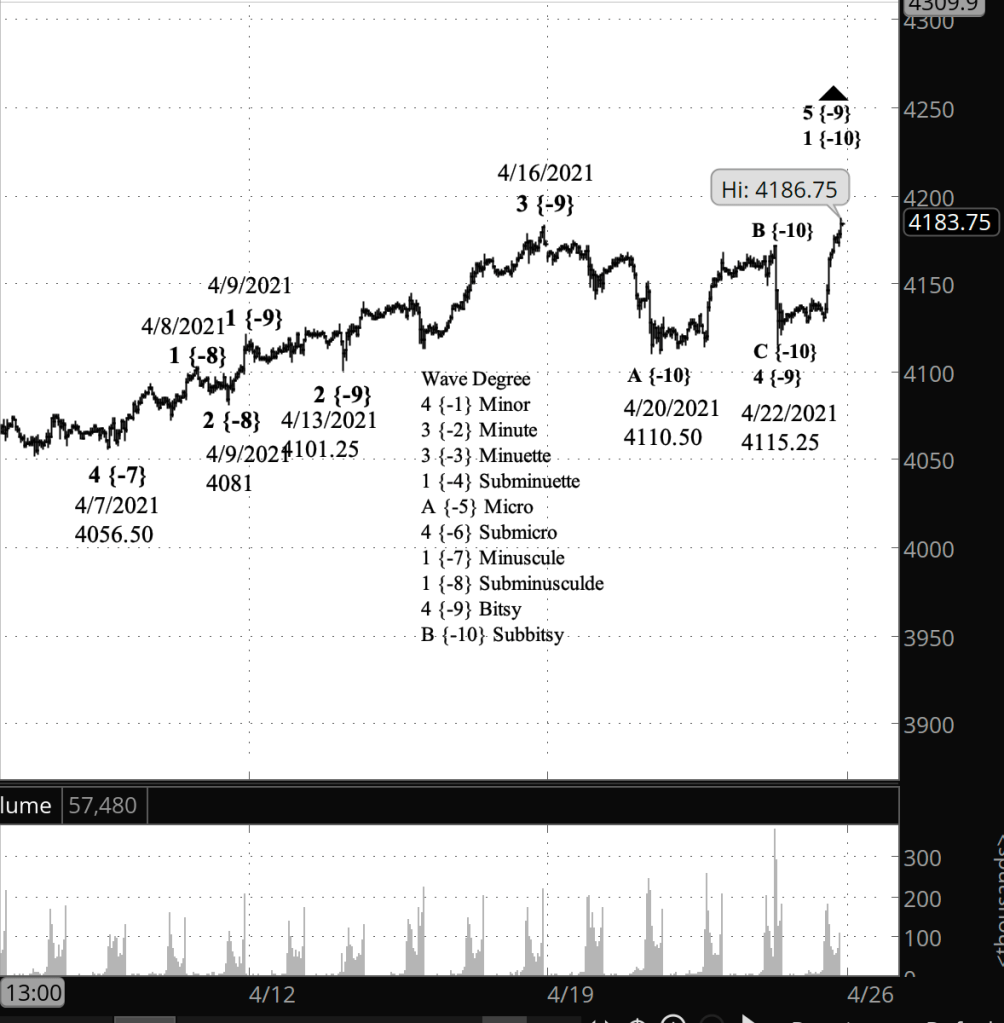
At the close.The high point of the day at the close was 4186.75 on the futures, 4194.17 on the index. In terms of Elliott wave analysis, the upward trend that began on April 22 is, from smaller to larger…
wave 1 of Subbitsy degree
within wave 5 of Bitsy degree
within wave 3 of Subminuscule degree
within wave 5 of Minuscule degree
within wave 3 of Submicro degree
within wave 3 of Micro degree
within wave 5 of Subminuette degree, which began its rise last December 21 from 3596 on the futures.
3:40 p.m. New York time
Twenty minutes before the closing bell. The S&P 500 has pushed up to a new high, resolving the count in favor of the bullish scenario.
[S&P 500 E-mini futures at 3:40 p.m., 40-minute bars, with volume]
9:50 a.m. New York time
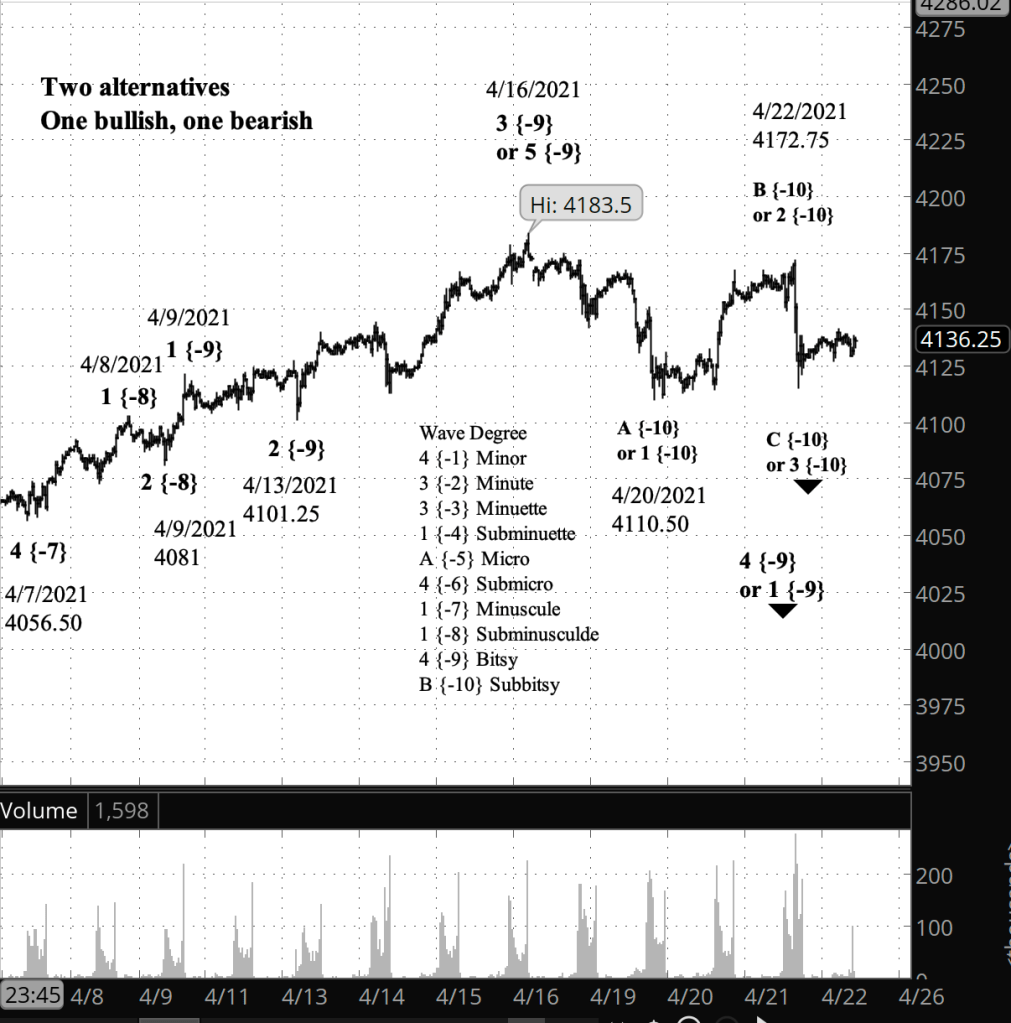
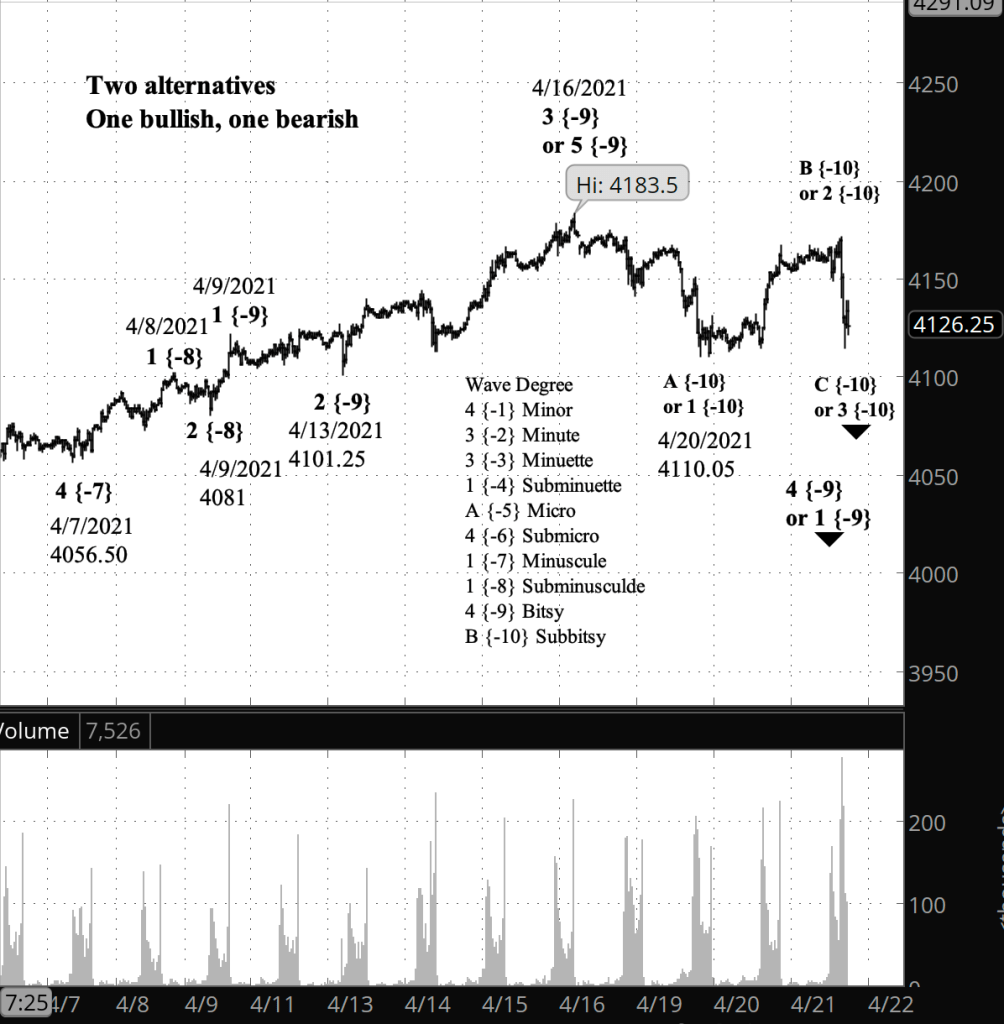
What’s happening now? Overnight trading of the S&P 500 E-mini futures did little to clarify the chart, and so I’ve retained the two interpretations — bullish and bearish — as the choice between them remains too close to call.
What does it mean? The bullish scenario: One more push downward and then a reversal up to new highs. The bearish scenario: A push downward to below 4110.50 on the first leg, and then lower still after a correction.
[S&P 500 E-mini futures at 9:48 a.m., 35-minute bars, with volume]
What does Elliott wave theory say? I took a longer glance at the rise from February 23, 2020 to a week ago, April 16, and it looks more like three waves up rather than five, which would lend a bit more credence to the bullish scenario. The count lacks the clarity to settle the choice. I’ll look at it in more detail this weekend.
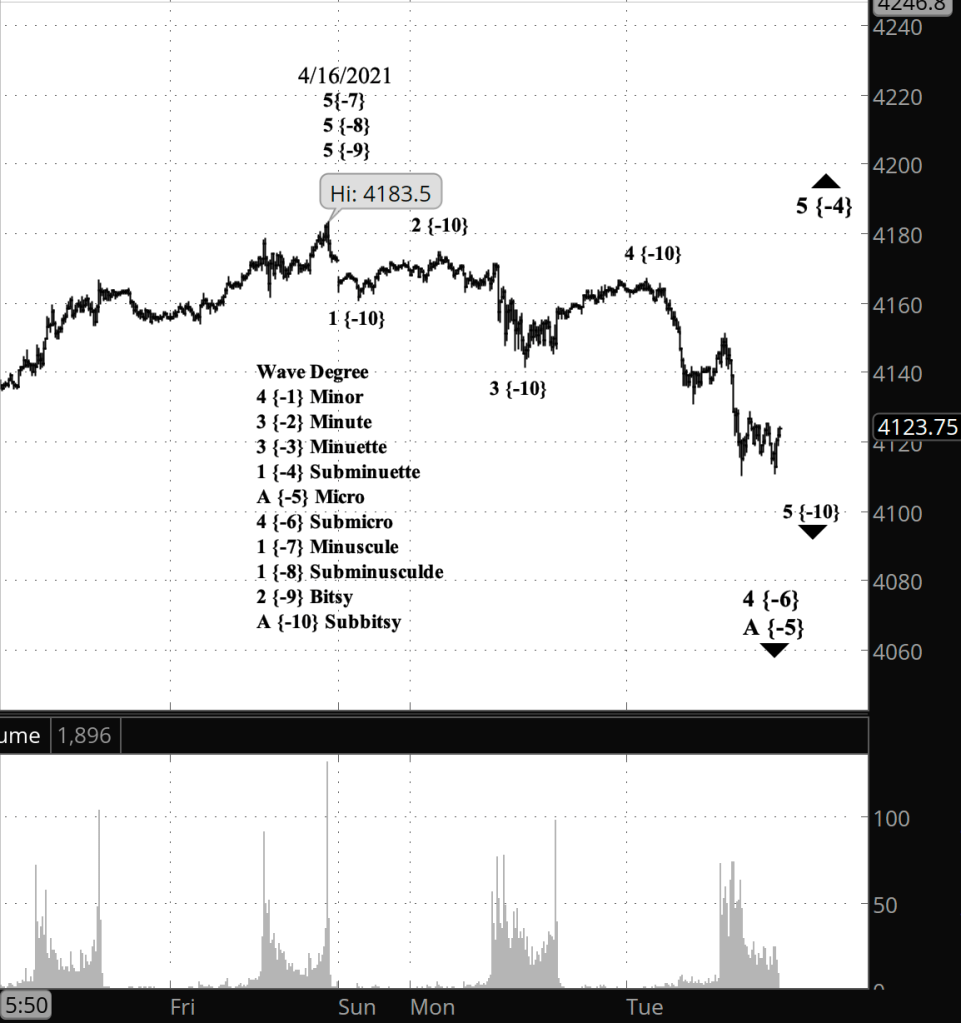
Close up, the bullish scenario counts the decline from the 3rd wave peak on April 16 as wave 4 of Bitsy degree, which will be followed by wave 5 Bitsy degree, which will reach new highs. The bearish scenario counts the decline from the 5th wave peak on April 16 as wave 1 of Bitsy degree, which will move below its low so far of 4110.50.
Just a passing thought: Elliott wave analysis requires the analyst to bring more intuition to pattern recognition than any other analytical tool I’ve used. Elliott is the best tool I’ve found, but it lacks rigor. What it does bring to the table is an ability to quickly change its conclusions about the market, and to provide signals that will communicate that changed conclusion. As a trader, I find that to be incredibly useful.
Half an hour before the closing bell. The S&P 500 declined during the day, the futures coming within 5 points of the low set on April 20. The movement doesn’t decide the question posed this morning: Is the bullish alternative count or the bearish alternative count the correct view of the chart? So we’ll head to the closing bell still puzzling over the ambiguity of the Elliott wave analysis. Interestingly, though, the volume picked up on the decline. So perhaps that’s a hint. Chart updated below.
9:40 a.m. New York time
What’s happening now? The S&P 500 E-mini futures leveled off somewhat in overnight trading.
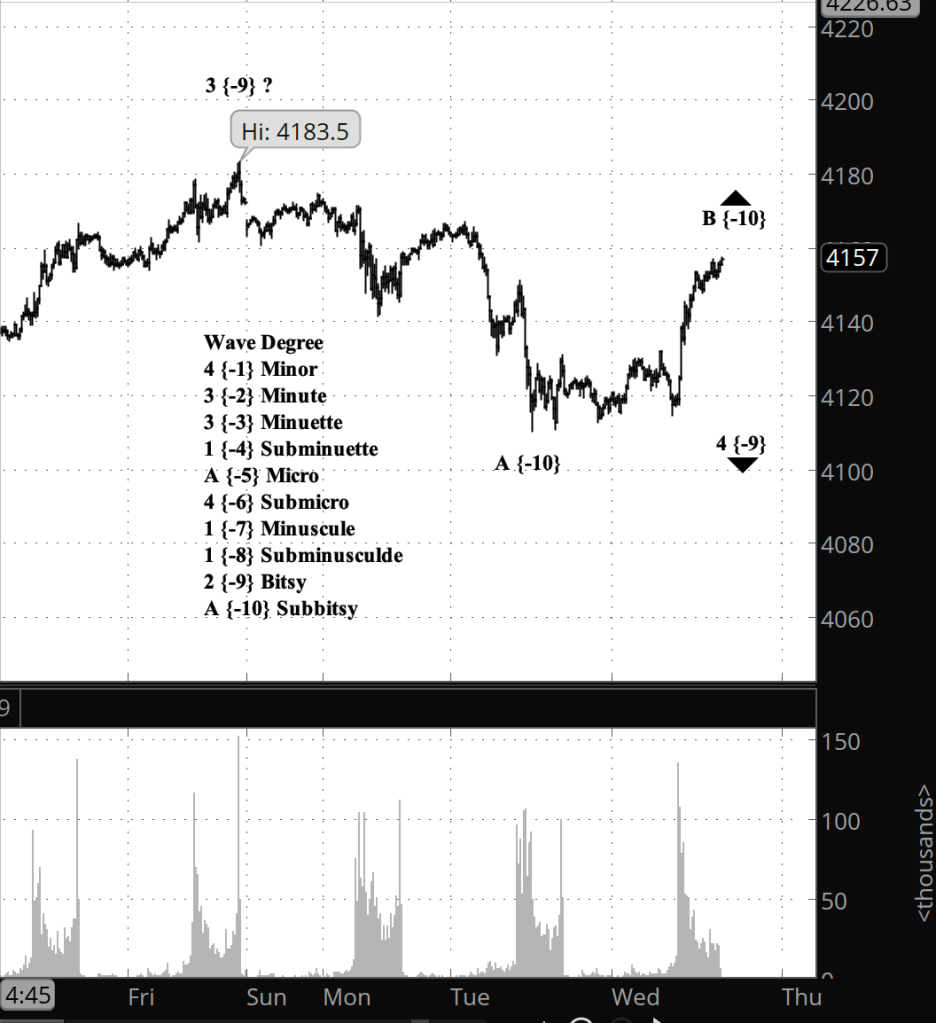
What does it mean? The sudden rise has thrown the chart into a high degree of ambiguity with no clear guidance on which alternative is most likely. One alternative is bullish, treating the decline since April 16 as a correction within an ongoing rise. The other is bearish, treating the decline as the beginning of a new downtrend. At this point I haven’t a clue as to which one will play out in the next weeks.
[S&P 500 E-mini futures at 3:30 p.m., 35-minute bars, with volume]
What does Elliott wave theory say? In the bullish scenario, the decline from April 16 is wave 4 of Bitsy degree, and internally wave A is complete and wave B is either in progress or complete. Bitsy wave 4 will be followed by a push to new highs — Bitsy wave 5.
In the bearish scenario, the decline from April 16 is wave 1 of Bitsy degree, and internally wave 1 is complete and wave 2 is underway and nearing completion. Bitsy wave 2 will be followed by a further, more energetic decline.
If the price moves above the peak of April 16 (4183.50 on the futures, 4191.31 on the index), and if the rise from April 20 has three waves internally, then the bullish scenario is correct.
If the price reverses downward to a significant degree and if the rise from April 20 has three waves internally, then the bearish scenario is correct.
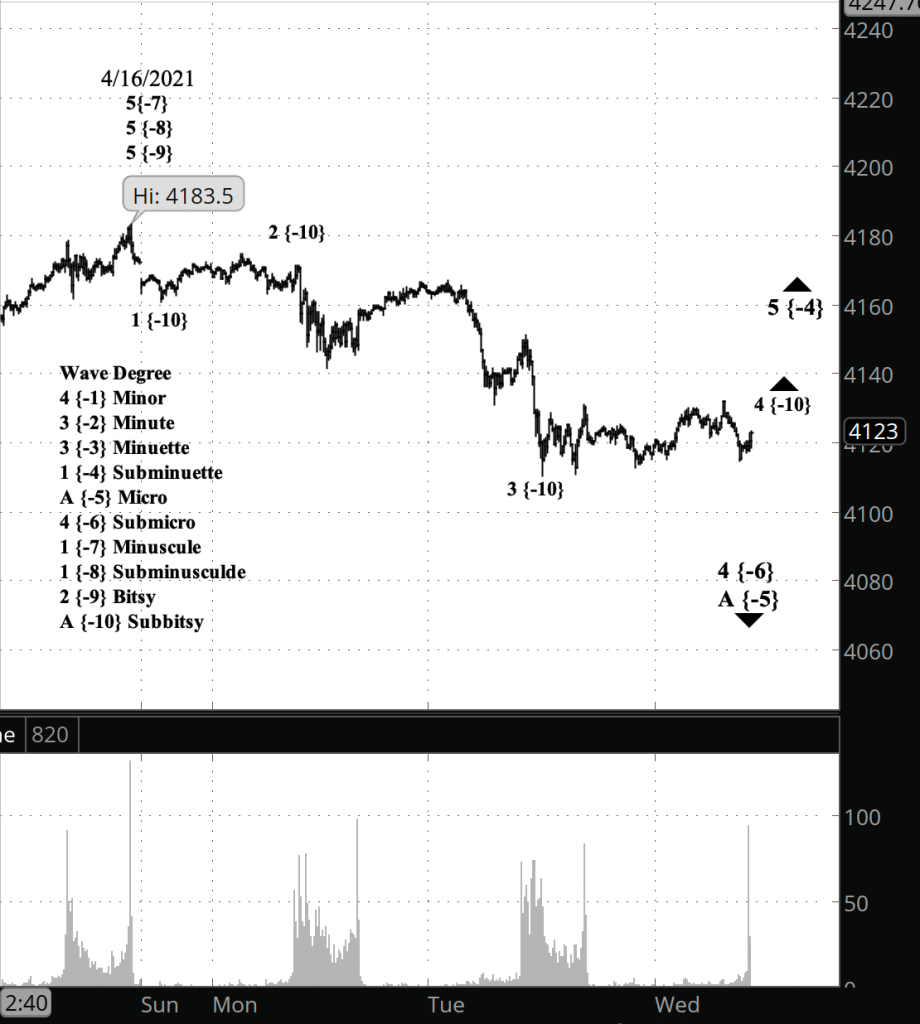
Half an hour before the opening bell. The S&P 500 has risen sharply at a very small level during the trading day, suggesting to me that the high of April 16 is not the end of the uptrend. In other words, I’m starting to lean toward this morning’s alternate conclusion.
Here’s a rough and ready chart that suggests what the alternate count would look like. I’m not ready to fully commit to it.
What’s happening now? The S&P 500 E-mini futures continued their downward move, reaching the late stage of the first declines of small degree from the high of 4183.50 reached on April 16.
What does it mean? Just as every avalanche begins with the loosening of a few flakes of snow, so a major downtrend begins with small declines and rises in the the five-way pattern of any trending market. This is where the avalanche metaphor breaks down. The first low degree decline is part of a larger degree, and the present decline will be followed soon by an upward correction that will remain below the high of April 16. Think of it as an avalanche in reverse.
What’s the alternative? It’s possible to the count the chart in a way that shows the high of April 16 was not the end of an uptrend. If the price rises above 4183.50 on the futures, 4191.31 on the index, then the uptrend is still underway.
[S&P 500 E-mini futures at 9:44 a.m., 10-minute bars, with volume]
What does Elliott wave theory say? The first loose flakes of snow in the present early days of an avalanche are at Bitsy degree, a degree so small that R.N. Elliott had no name for it. Presently the 1st degree of that small downtrend is in Subbitsy wave 4, which will be followed by Subbitsy wave 5 to the downside, completing the 1st wave of the Bitsy degree.
What follows will be an upward correction, most likely a simple Zig-zag pattern of three waves that will take back much of the decline since April 16 while remaining below the April 16 peak of 4183.50. The upward correction will be followed by wave 3 of Bitsy degree, which is likely to be quite a bit more energetic than was its 1st wave counterpart.
Half an hour before the closing bell. The S&P 500 continues its downward course from the peak on April 16 of 4183.50 on the futures, 4191.31 on the index. I’ve updated the near-term chart.
10:10 a.m. New York time
What’s happening now? The S&P 500 E-mini futures completed the first leg down at a small degree in a downtrend that began April 16 from 4183.50, reaching a low of 4131.
What does it mean? The overnight decline marks the start of a major movement to the downside that eventually will reach beyond the low of 2191.86 on the index, set on February 23, 2020, in the first month of the pandemic. The overnight low marks the start of small upward correction that will remain below the April 16 high.
What’s the alternative? It’s still possible my labeling of the April 16 high as the end of the rise will prove wrong, if the price rises above 4183.50. The internal count of the rise ending on that date suggests to me that it was indeed the end, but Elliott wave analysis is filled with ambiguities. Time will tell.
[S&P 500 E-mini futures at 3:30 p.m., 10-minute bars, with volume]
[S&P 500 index at 10:07 a.m., 2-day bars]
What does Elliott wave theory say? In the short-term, wave 1 of Bitsy degree ended overnight at 4131 and wave 2 of Bitsy degree has begun its 2nd wave, an upward correction, which is now in its A wave of Subbitsy degree. This is all happening within wave 1 of Subminuscule degree and its parent, wave 1 of Minuscule degree.
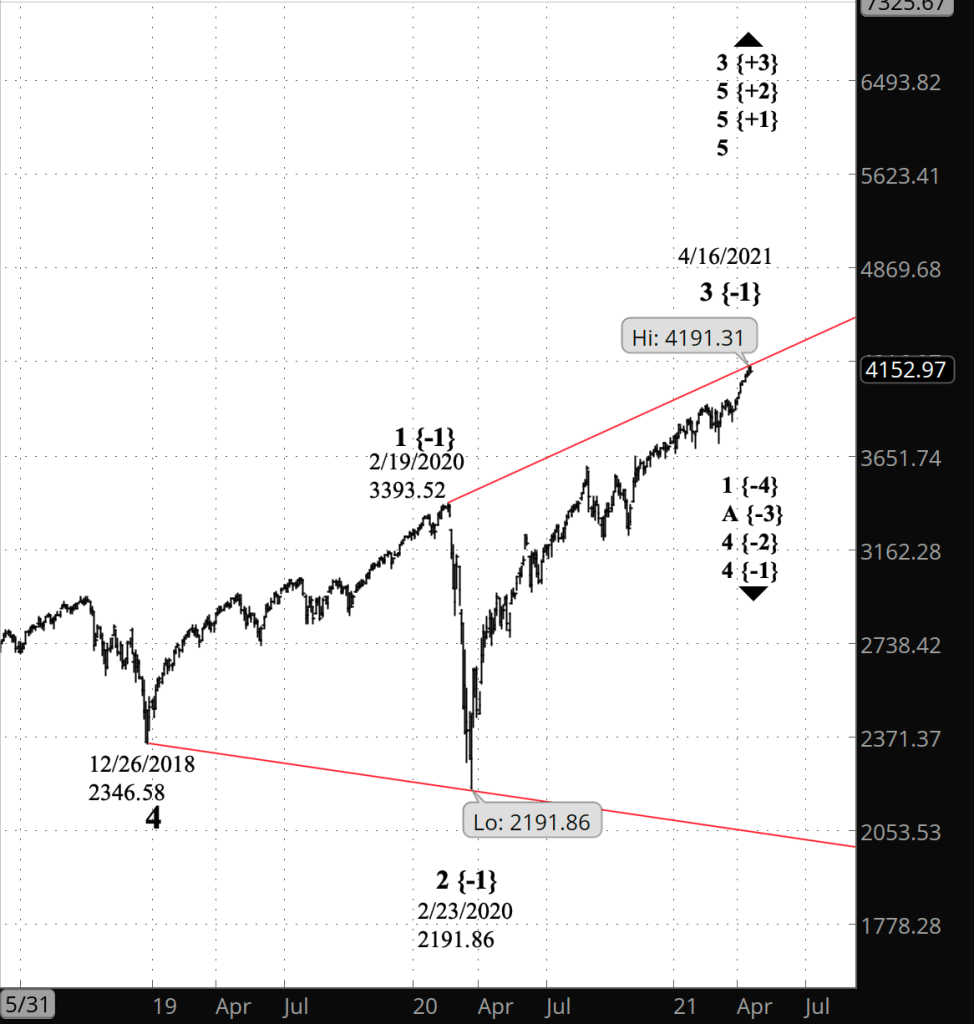
In the long term, the April 16 peak of 4183.50 marks the beginning of wave 3 of Minor degree, the next large downward movement of a diagonal triangle that began on December 26, 2018. The boundaries of the triangle are moving away from each other — an expanding triangle — and at this point the current price is near the upper boundary and the lower boundary is around 2054.
It will take time, with many ups and downs on the journey, but the price’s destination is that lower boundary.
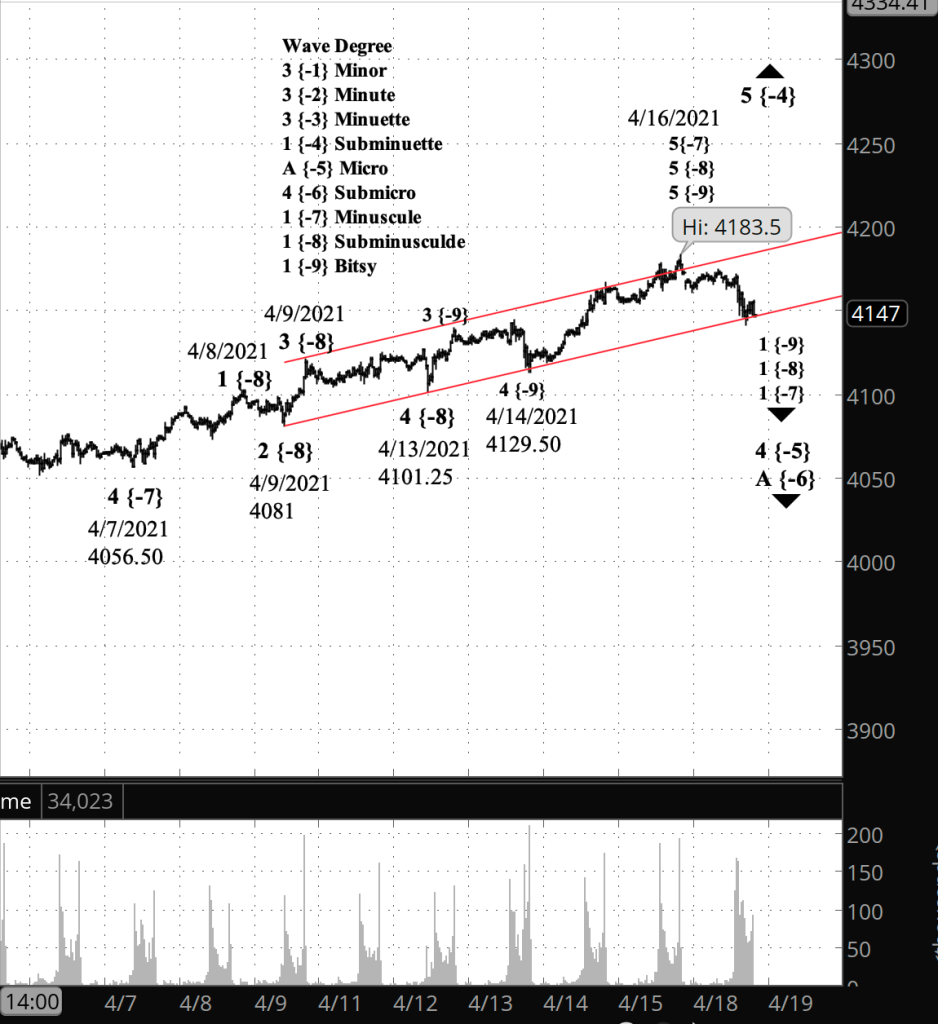
Half an hour before the closing bell. The S&P 500 fell during the day to the lower boundary of the price channel of Subminuscule degree. A break below the boundary will be evidence that Subminuscule wave 5 ended on April 16. A break below the April 14 low, 4129.50 on the futures, will provide stronger evidence. I’ve updated the chart below.
10:15 a.m. New York time
What’s happening now? The S&P 500 E-mini futures fell from Friday’s peak of 4183.50, to a low in overnight trading of 4154.75.
What does it mean? The peak marks the end of the rise that began on April 7 and the beginning of downward correction.
What are the alternatives? Another possible analysis is suggests that the rise from April 7 is still underway in its late phase, and that the decline overnight is a correction within that rise. I consider this to be a less likely possibility based on the proportionality the decline so far.
[S&P 500 E-mini futures at 3:30 p.m., 30-minute bars, with volume]
What does Elliott wave theory say? The high of April 16 (futures: 4183.50, index: 4191.31) marks the end of wave 5 of Minuscule degree and internally, down to Bitsy degree. Above Minuscule, it is also the end of wave 3 of Micro degree and its child wave 3 of Submicro degree. This is all happening within the rising wave 5 of Subminuette degree, which began March 4.
At the higher degrees — MIcro and Submicro — the S&P 500 has entered 4th wave corrections. Fourth waves are followed by 5th waves, to the upside in this case, that finish the trend.
Fourth waves, as is normal within all Elliott wave constructs, are composed internally of uptrends and downtrends. In this case, I’ve labeled the A wave — the first wave of the correction — at the Submicro degree, within wave 4 of Micro degree. An A wave internally can have 5 waves, labeled 1 through 5, if it is a Zigzag, or three waves, labeled A through C, if it is a Flat. I’ve used the numerical labelling within Submicro wave A, but that could change.
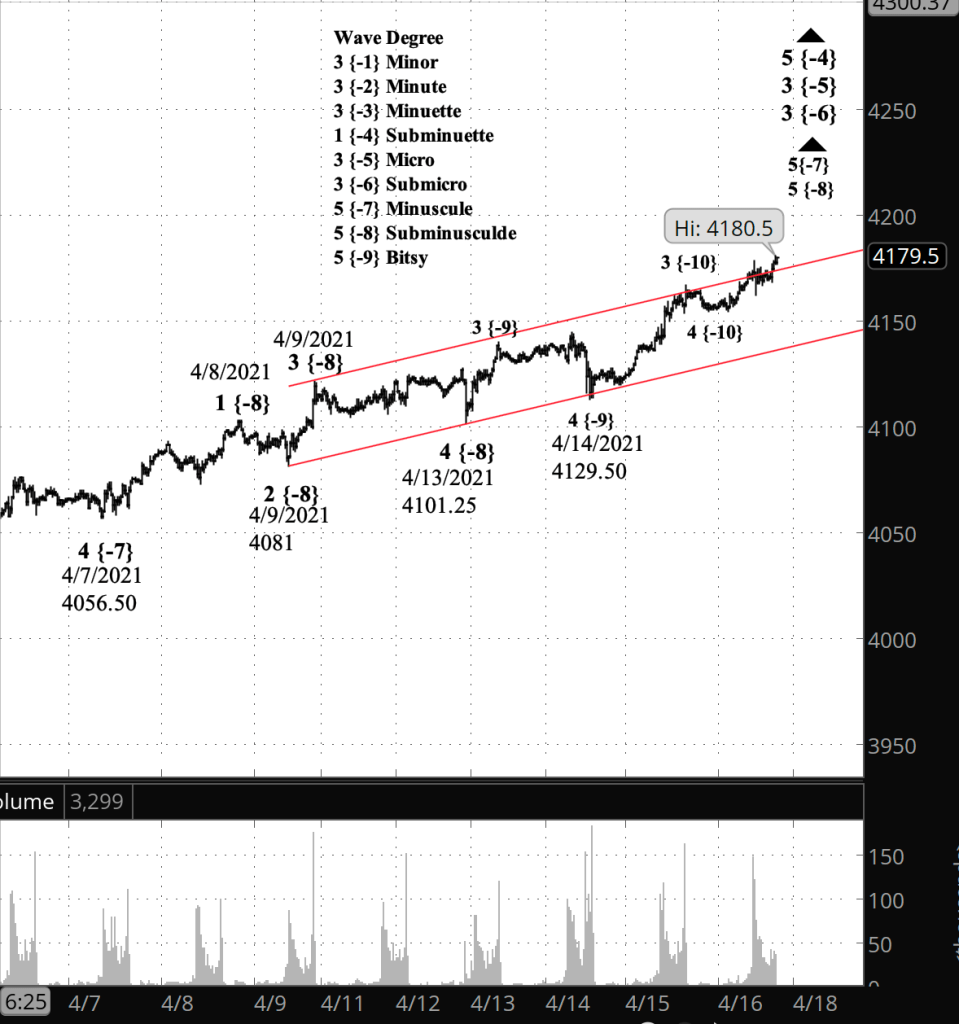
Half an hour before the closing bell. The S&P 500 rose to new heights today, the futures to 4180.50 and the index to 4188.21, as wave 5 of Minuscule degree and below continued its course. I’ve updated the chart below.
10 a.m. New York time
What’s happening now? The S&P 500 E-mini futures pushed above the upper boundary of the price channel in overnight trading, reaching a high of 4178.50 in the final leg of its rise that began April 14.
What does it mean? Today’s high could be the end of that rise, and indeed of the rise that began April 7. It will be followed by a higher degree correction, most likely of the shallow variety.
What are the alternatives? Although, it needn’t be the end of the rise. There could still be more upside potential into next week.
[S&P 500 E-mini futures at 3:30 p.m., 25-minute bars, with volume]
What does Elliott wave theory say? The overnight rise is wave 5 of Subbitsy degree within a series of 5th waves of increasing size, Bitsy degree within Subminuscule degree within Minuscule degree. And all of that is within wave 3 of Submicro degree, the degree of coming 4th wave correction. Submicro 3 began on March 25.
The question is at what point does Subbitsy wave 5 come to an end. There is no set length for 5th waves, as long as the preceding 3rd wave isn’t the shorter than both waves 1 and 5, and so each new high is potentially the end of wave 5, or potentially just another milestone on the continuing rise.
My trades. Having exited NIO for a profit yesterday, I looked at the possibility of entering another position using the options that expire May 16. By my rules, the entry window closed on April 13, but for a good enough trade, I could fudge the rules by a day or two. Two sufficiently liquid stocks — SNAP and TWTR — have implied volatility ranks (IVR) of 30% or higher. However, SNAP publishes earnings on April 22 and TWTR, on April 29. I don’t hold options positions through earnings announcements — too many unknowns — and so I’m passing the opportunity.
My next entry window, for trades using options expiring June 21, has an entry window open from April 27 to May 11, with May 4 being the midpoint that I usually prefer.
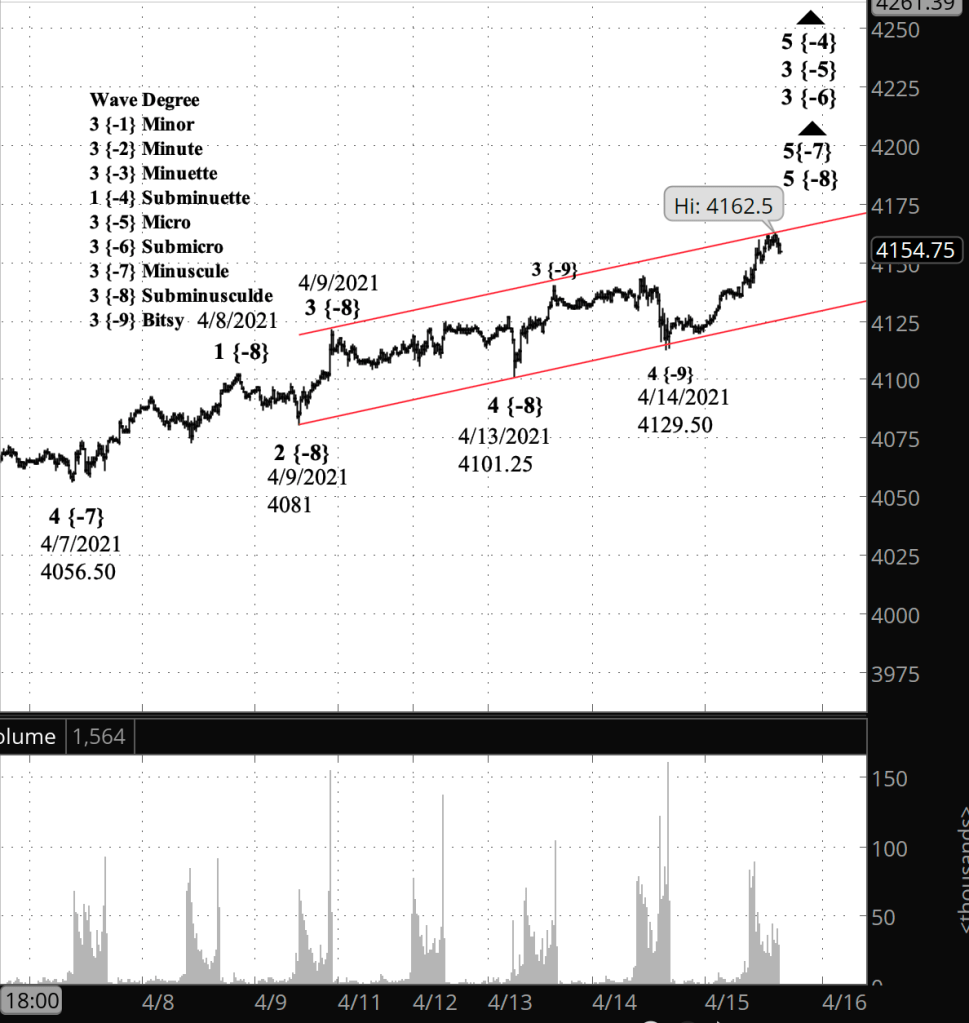
Half an hour before the closing bell. The S&P touched the upper boundary of the price channel, with highs of 4162.50 on the futures and 4169.58 on the index. As the closing approached the price hovered slightly below high point. Based on the form on the chart, it appears to me that the rise has another push higher at a very low degree before the correction begins. I’ve updated the chart below.
2:15 p.m. New York time
My trade. I’ve updated the entry analysis of my short bear call options position on NIO with full results and a discussion of my exit decision. The options used to build the position expire on May 16. The window for trading May 16 options expired two days ago. Nonetheless, I’ll take a look to see if there’s anything interesting enough to allow me to fudge my rules. Another NIO trade is out, as the implied volatility rank has fallen sharply, to 11% at exit. My rules require 30% or better.
9:50 a.m. New York time
What’s happening now? The S&P 500 E-mini futures reversed overnight, climbing from a low of 4129.50 climbing to 4148 shortly after the opening bell. The high so far on the index is 4156.56. The reversal followed a sharp one-day decline on Wednesday.
What does it mean? The reversal is in light with yesterday’s closing analysis: “The decline will be followed by a rise back toward the upper boundary of the channel, now in the low 4150s, and perhaps overshoot the boundary in the final rise” of small degree. Once the rise is complete, the price will begin a shallow correction at a higher degree.
What are the alternatives? It’s possible that the final upward push will be truncated, and the high so far this morning could in fact be the end of the rise.
[S&P 500 E-mini futures at 3:30 p.m., 20-minute bars, with volume]
What does Elliott wave theory say? Wave 5 of Bitsy degree began with the overnight reversal and continues its upward course toward the upper boundary of the Subminuscule degree price channel, marked in red on the chart. Bitsy 5 is within wave 5 of Subminuscule degree, and, in increasing size, within wave 5 of Minuscule degree, wave 3 of Submicro degree and wave 3 of Micro degree. The simultaneous completion of wave 5 of Bitsy, Subminuscule and Minuscule degree will be followed by a 4th wave correction one degree higher, at the Submicro degree.
My trading. I exited my short bear call options spread on NIO for $0.38 per contract/share, or 49.3% of maximum potential profit. My goal is 50%, so I count it as a win. I’ll update the entry analysis with results later today.


You must be logged in to post a comment.