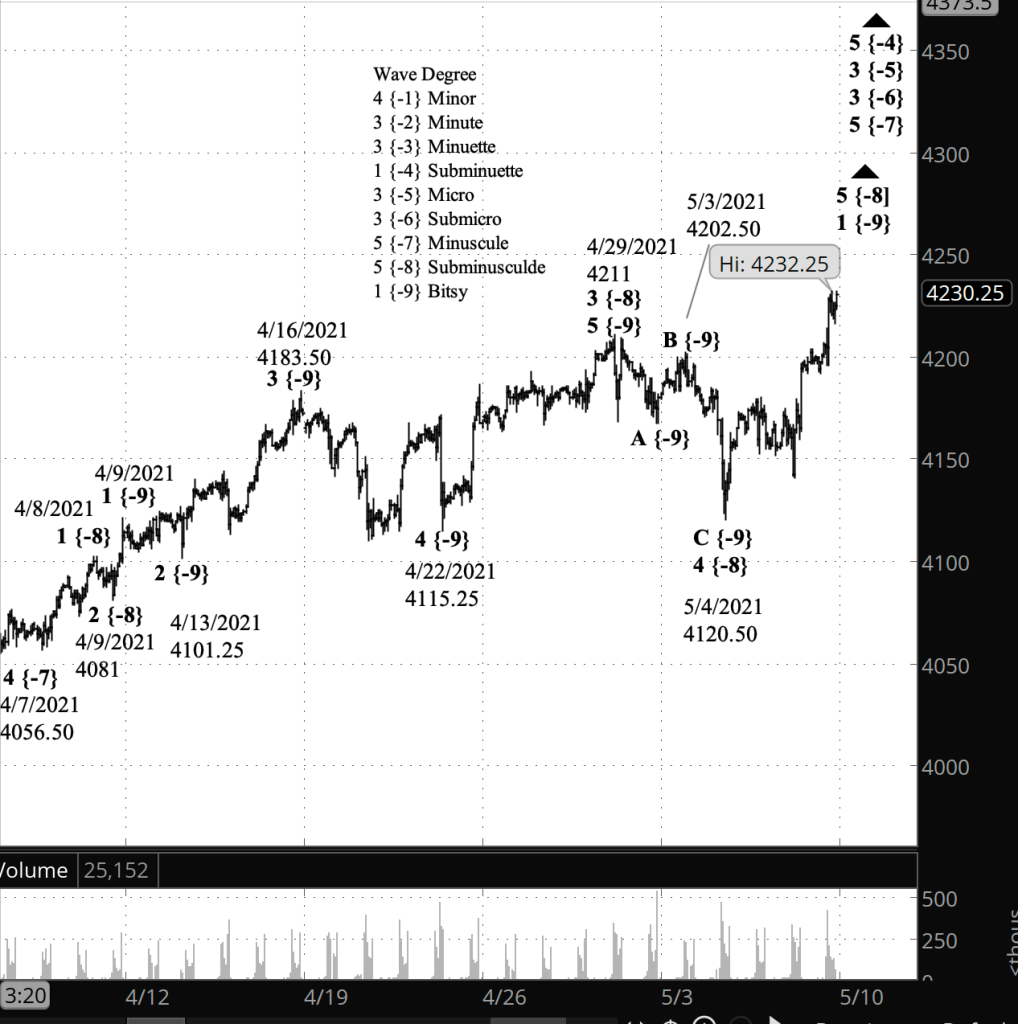
Half an hour before the closing bell. The S&P 500 continued pushing higher, reaching 4232.25 on the futures and 4238.04 on the index. No change in the analysis. I’ve updated the chart.
10:15 a.m. New York time
What’s happening now? The S&P 500 E-mini futures rose to a new high, 4228.25 so far, in a renewal of an uptrend that had been interrupted by a brief correction.
What does it mean? The new high exceeded the prior high, 4211 set on April 29, and in so doing forced a recount of the principle analysis: The correction that began on April 29 ended on May 4, and on that date the final wave of the rise from April 7 began.
What’s the alternative? As always, identifying the magnitude early on in a market movement is a guess, because the movement lacks context. The magnitudes of waves in my analysis could well change as the uptrend progresses.
[S&P 500 E-mini futures at 3:30 p.m., 70-minute bars, with volume]
What does Elliott wave theory say? The high of 4211 on April 29 marked the end of wave 3 of Subminuscule degree and the beginning of a 4th wave correction. The correction took the form of three waves, each with three waves internally, making it a Flat pattern that ended on May 4 at 4120.50. The subsequent wave 5 of Subminuscule degree began and has so far carried the price to a high this morning of 4228.25 and climbing.
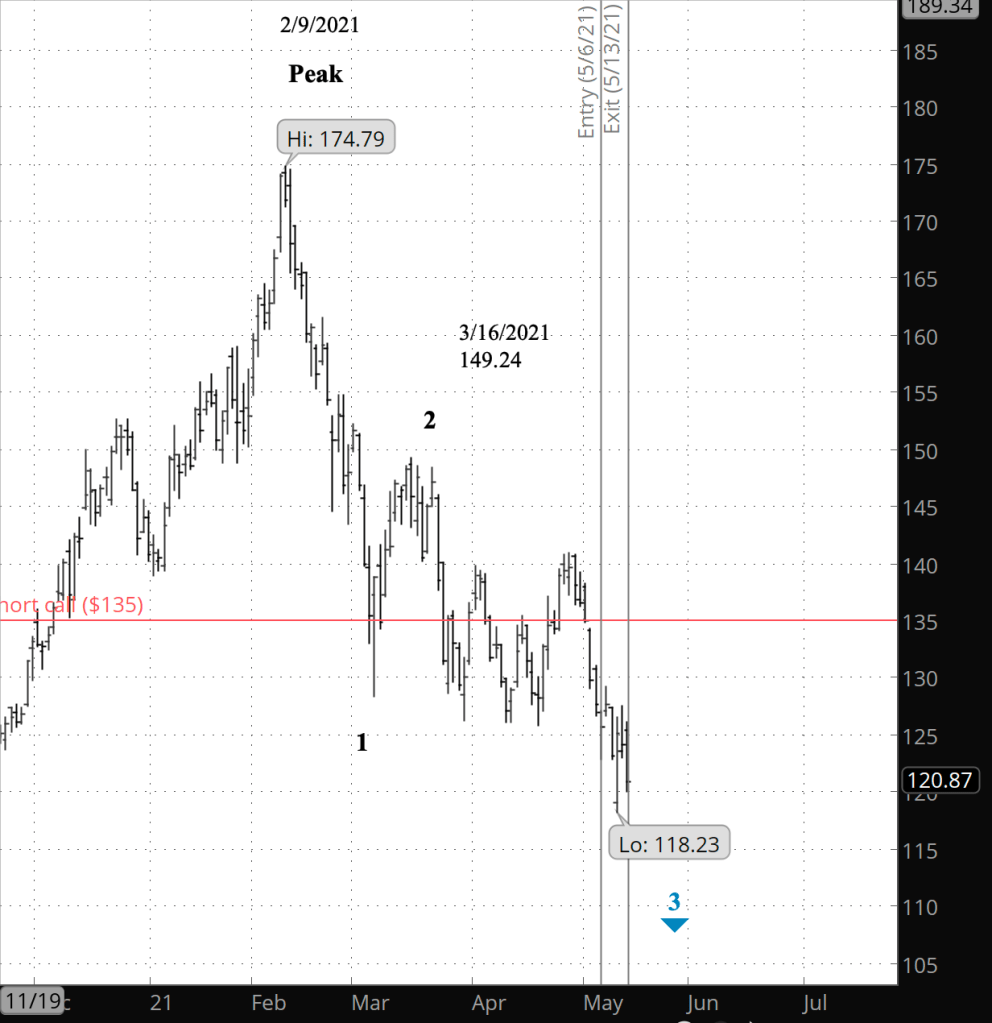
Update 5/13/2021: I exited my bear call spread position on XBI 36 days before expiration, for a $0.50 debit per contract/share, a profit before fees of $102 per contract. Shares were trading at $120.40, down $5.19 from the entry level.
My decision to exit was based on the profit exceeding 50% of its maximum potential, an exit point that is mandated by my rules for trading options spreads.
Shares declined by 4.1% over seven days for a -216% annual rate. The options position produced a 97.6% return for a 5,319% annual rate.
I’ve updated the chart below.
I have entered a short bear call spread on XBI, using options that trade for the last time 43 days hence, on June 18. The premium is a $1.01 credit per contract share and the stock at the time of entry was priced at $125.59.
The implied volatility rank (IVR) stands at 49.2%.
Premium:
$1.01
Expire OTM
XBI-bear call spread
Strike
Odds
Delta
Calls
Long
140.00
85.0%
18
Break-even
133.99
80.5%
23
Short
135.00
76.0%
28
The premium is 40.4% of the width of the position’s wing. The profit zone covers a 6.7% move to the upside, with no limit to the downside.
The risk/reward ratio is 4:1, with maximum risk of $399 and maximum reward of $101 per contract.
Elliott wave analysis. XBI hit a peak of February 9 of $174.79 and began a downtrend that is now in its 3rd wave. I set the short call at $135, which is $9.41 above the entry price. The 3rd wave, typically the strongest in a trend, began on March 16 from $149.24. Upon its completion, the 3rd wave will begin a 4th wave correction. Fourth waves tend to be shallow, sideways-trending movements, and so my theory is that any correction will remain well below the $135 short-call strike.
[Exit chart: XBI, daily bars]
By Tim Bovee, Portland, Oregon, May 6, 2021
Disclaimer
Tim Bovee, Private Trader tracks the analysis and trades of a private trader for his own accounts. Nothing in this blog constitutes a recommendation to buy or sell stocks, options or any other financial instrument. The only purpose of this blog is to provide education and entertainment.
No trader is ever 100 percent successful in his or her trades. Trading in the stock and option markets is risky and uncertain. Each trader must make trading decisions for his or her own account, and take responsibility for the consequences.
Half an hour before the closing bell. The S&P 500 E-mini futures rose to within 50 cents of the May 4 high and then resumed its downward trajectory, leaving my principle analysis intact. I’ve updated the chart.
12:50 p.m. New York time
My trades. I’ve entered a bear call options spread on XBI. The entry analysis may be found here.
9:45 a.m. New York time
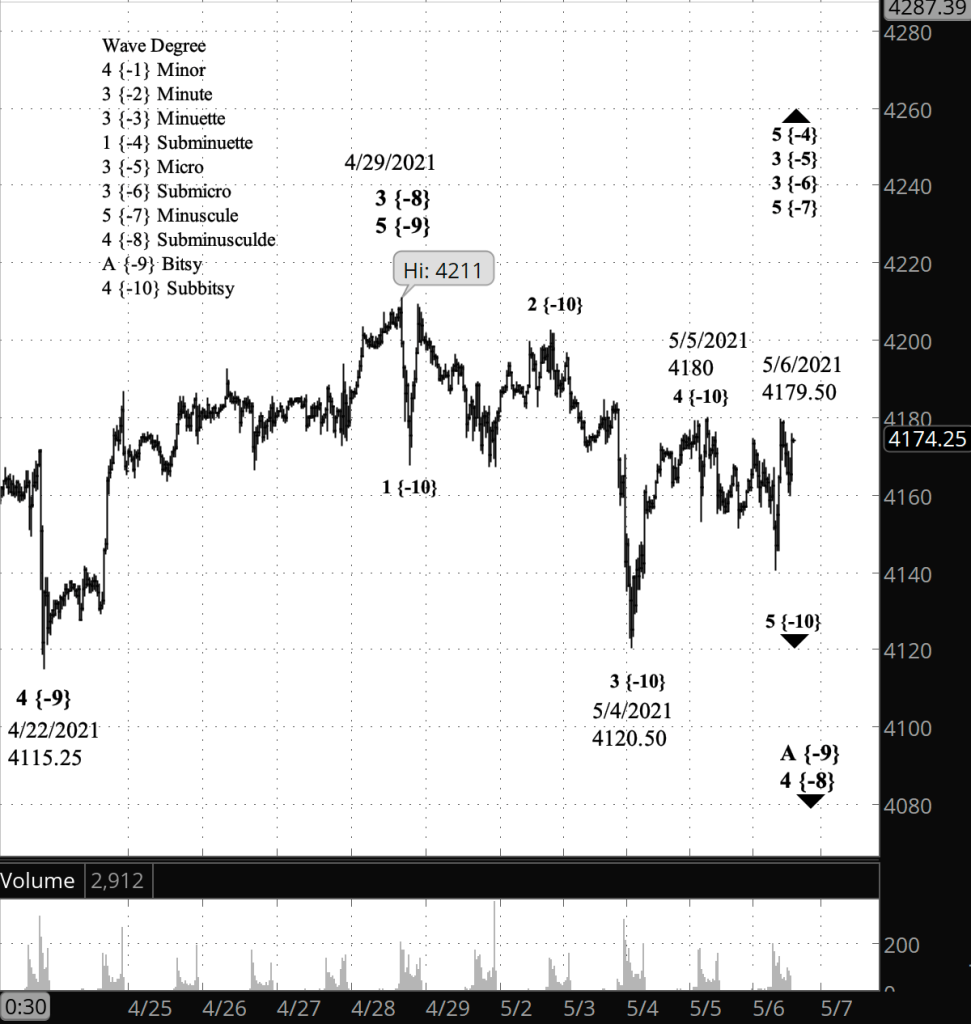
What’s happening now? The S&P 500 E-mini futures traded in a narrow range overnight as the price moved through the late stage of the beginning leg of a downward correction.
What does it mean? The correction, which began on April 29 from 4211, has so far reached a low of 4120, on May 4. The tentative decline that began yesterday a 4180 will carry the price below the April 29 low to complete the first leg of a larger correction to the downside.
What’s the alternative? It’s possible that the first leg of the larger correction has not yet reached its final decline. Instead, the upward countertrend within the larger downtrend may still be underway.
[S&P 500 E-mini futures at 3:30 p.m., 30-minute bars, with volume]
What does Elliott wave theory say? The larger downtrend is wave A of Bitsy degree within wave 4 of Subminuscule degree, the latter having begun on April 29. Within wave A, wave 5 of Subbitsy degree will carry the price below 4120.50, which was the end of wave 3 of Subbitsy degree. Once Subbitsy 5 is complete, the next step will be an upward movement, wave B of Bitsy degree, the middle wave of the Subminuscule wave 4 correction.
The alternative count has Subbitsy wave 4 underway, with Subbitsy 5 still in the future. A decisive move to the downside would confirm that Subbitsy 5 has begun.
Half an hour before the closing bell. The S&P 500 dropped sharply and recovered before resuming the decline in wave 5 of Subbitsy degree within wave A of Bitsy degree. I’ve updated the chart.
9:40 a.m. New York time
What’s happening now? The S&P 500 E-mini futures rose overnight as it nears an end to the first leg of a downward correction that began April 29 from 4211.
What does it mean? After the rise is complete, a decline will carry the price back down, most likely below 4120.50, completing the first leg of the correction.
What is the alternative? It’s possible to count the decline to the May 4 low of 4120.50 as completing the correction. If the rise carries the price above 4211, then the alternative count is correct.
[S&P 500 E-mini futures at 3:30 p.m., 30-minute bars, with volume]
What does Elliott wave theory say? Under the principal count, the overnight rise is wave 4 of Subbitsy degree within wave A of bitsy degree, which in turn is the first wave of a three-wave correction within wave 4 of Subminuscule degree. Under the alternative count, the fall to 4120.50 was wave C of Bitsy degree, completing wave 4 of Subminuscule degree, and the overnight rise is the beginning of wave 5 of Subminuscule degree.
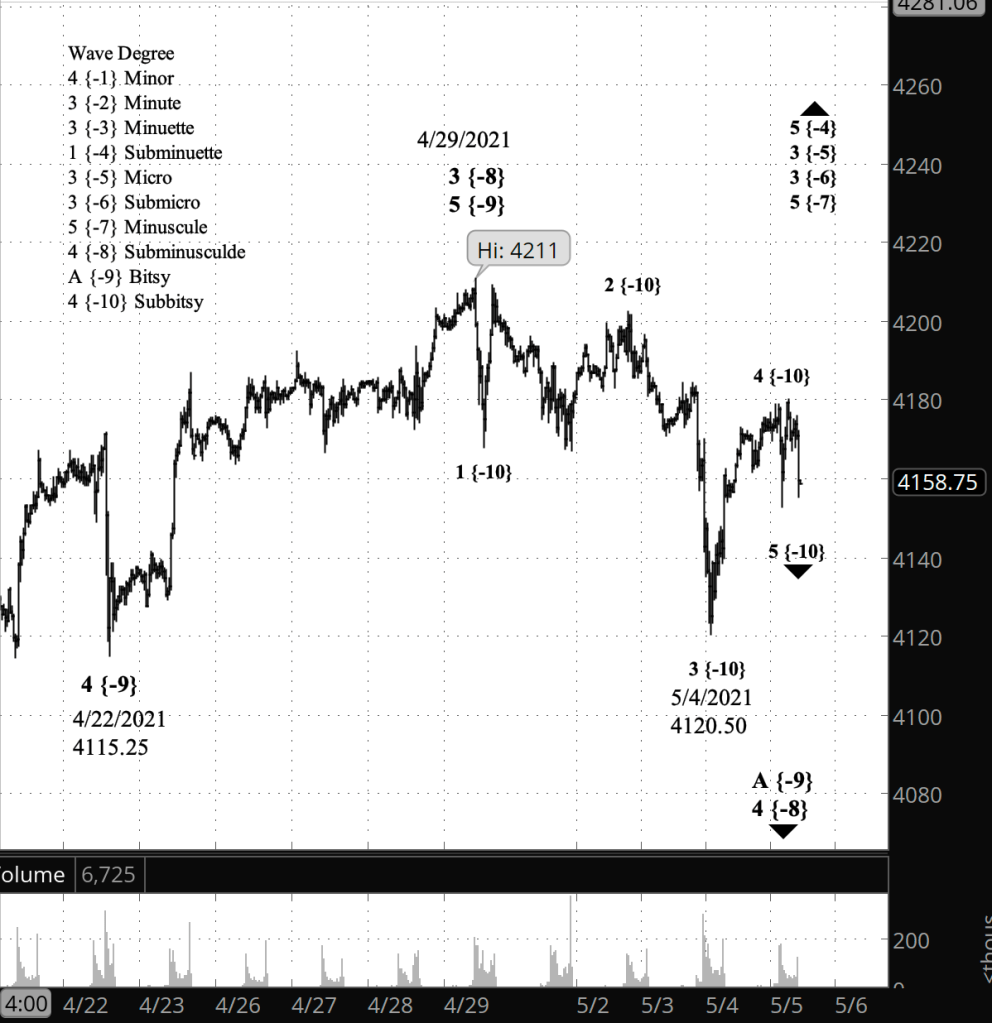
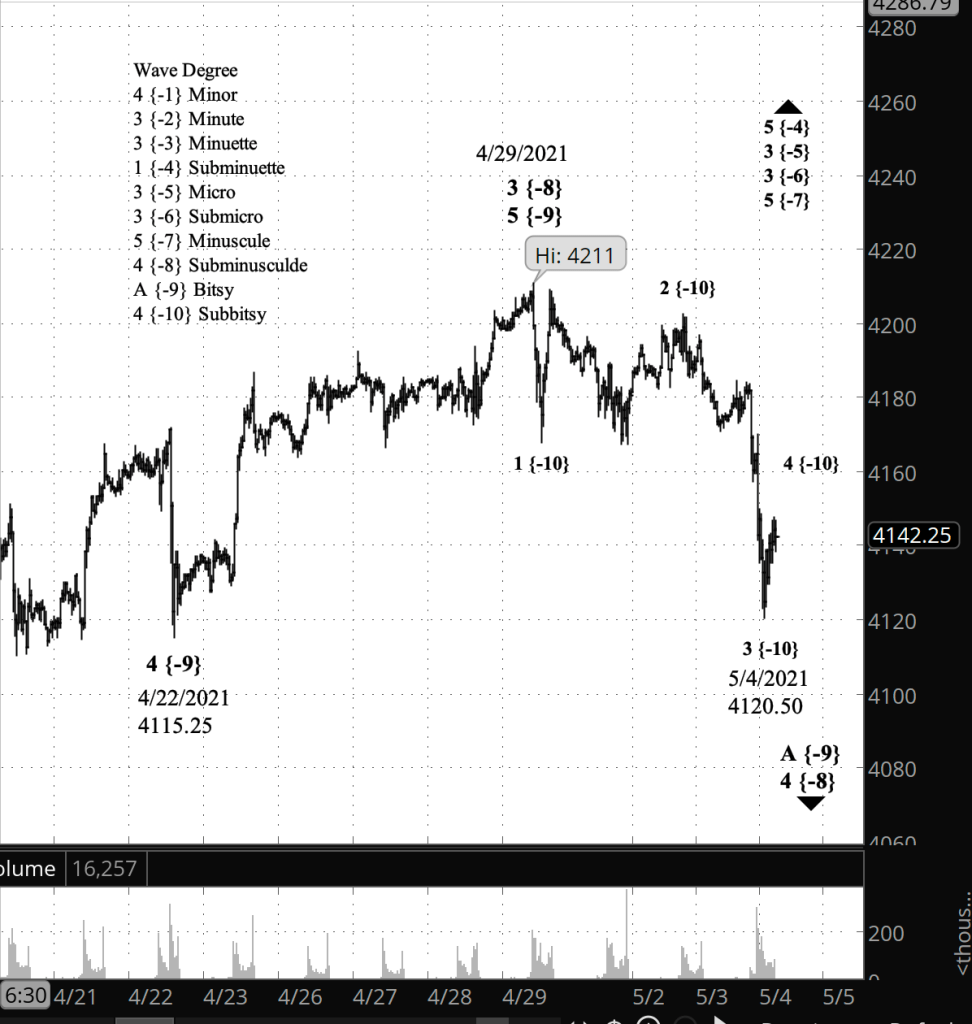
Half an hour before the closing bell. The S&P 500 declined sharply today in the middle wave of a larger decline that began April 29. The price on the E-mini futures reached a low of 4120.50 and late in the day reversed to the upside. I’ve updated the chart, below, moving closer in on the chart and adjusting the count in light of the sharp decline, which was wave 3 of Subbitsy degree within wave A of Bitsy degree. The price reversal to the upside is wave 4 of Subbitsy degree.
Regarding the My Trades section below, the prospect SNAP has seen its implied volatility rank decline below the point where the trade would be worthwhile. So tomorrow, the search continues.
9:55 a.m. New York time
What’s happening now? The S&P 500 E-mini futures declined to their lowest point since the April 29 high.
What does it mean? The decline appears to be near the end of the first leg of a downward correction, which will eventually be followed by a return of the uptrend that will carry the price to new highs.
[S&P 500 E-mini futures at 3:30 p.m., 30-minute bars, with volume]
What does Elliott wave theory say? The decline that began in Monday’s session is wave 5 of Subbitsy degree within wave A of Bitsy degree, which is the first wave of wave 4 of Subminuscule degree, which began on April 29 from 4211. Subminuscule 4 will most likely take the form of a Flat, and as a 4th wave it wouldn’t be unusual for it to extend in a compound pattern consisting of several corrective forms. Although it may not. There’s no guarantee either way.
These low-degree moves are unfolding within wave 3 of wave 5 of Minuscule degree, which began on April 7, and — working up — are within wave 3 of Submicro degree, which began on March 25 from 3843.25. That means there’s quite a bit of uptrend ahead for the patient, although the S&P 500 is presently in a downward correction.
My trades. By my rules today is the midpoint of the entry gateway for the options expiring June 18. The gate will remain open until May 11. Between trades I moved some of my options-trading funds into HYLB shares in order to capture a dividend, whose record date is tomorrow, May 5. I’ll hold off on entering my options position until May 6, when I’ll exit HYLB, freeing up those funds.
I presently have one (!) prospect that is both sufficiently liquid and has a sufficiently high implied volatility rank to be worthwhile; it is SNAP, and that will be my focus in prepping for my next position.
Half an hour before the closing bell. The S&P 500 traded in a narrow range today, dawdling along at same pace as in the overnight session. No change in the analysis. I’ve updated the chart.
9:50 a.m. New York time
What’s happening now? The S&P 500 E-mini futures continued a slow rise through the 4190s after trading resumed overnight in a counter-trend movement within a downward correction.
What does it mean? The correction will be followed by a reversal to the downside that will reach below 4115.25, perhaps significantly below.
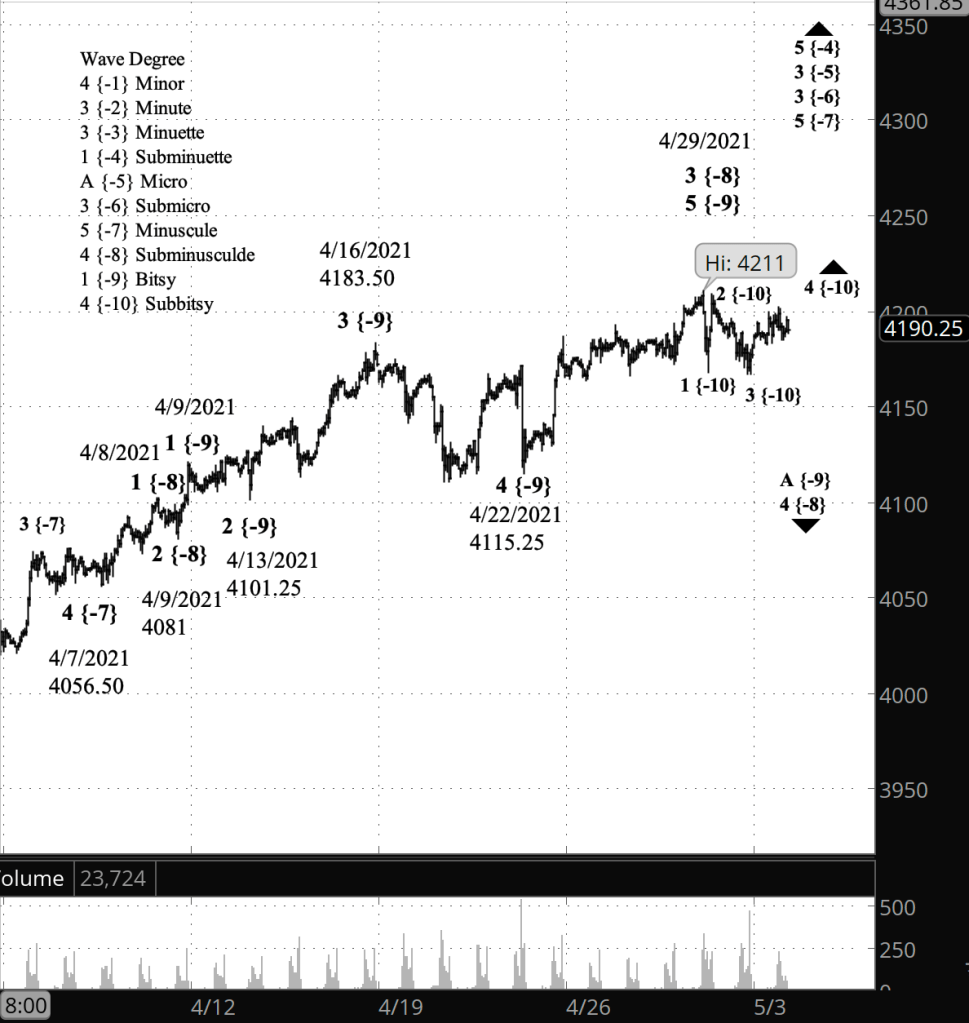
What’s the alternative? By my analysis the peak of 4211, reached on April 29, ended the rise that began April 22. It is possible that the decline since late April has been a pullback within the continuing rise and that the price will move to new highs.
[S&P 500 E-mini futures at 3:30 p.m., hourly bars, with volume]
What does Elliott wave theory say? The peak of April 29 ended wave 5 of Bitsy degree and its parent degree, wave 3 of Subminuscule degree. The decline that followed is the early sub-waves of wave A of Bitsy degree within wave 4 of Subminuscule degree.
The low degree Zigzag that I’ve labeled as waves 1 through 4 of Bitsy degree may in fact be of a smaller degree. In Elliott, there’s much ambiguity about the magnitude of a movement until it has had time to mature.
What’s happening now? Bitcoin futures continue their correction and now are on the third and possibly last leg of an upward movement within a larger downtrend.
What does it mean? The correction upon completion will be followed by a resumption of the downtrend.
What’s the alternative? If the correction extends into a compound structure, then the present final leg will be followed by a shallow downward movement, and the another corrective structure.
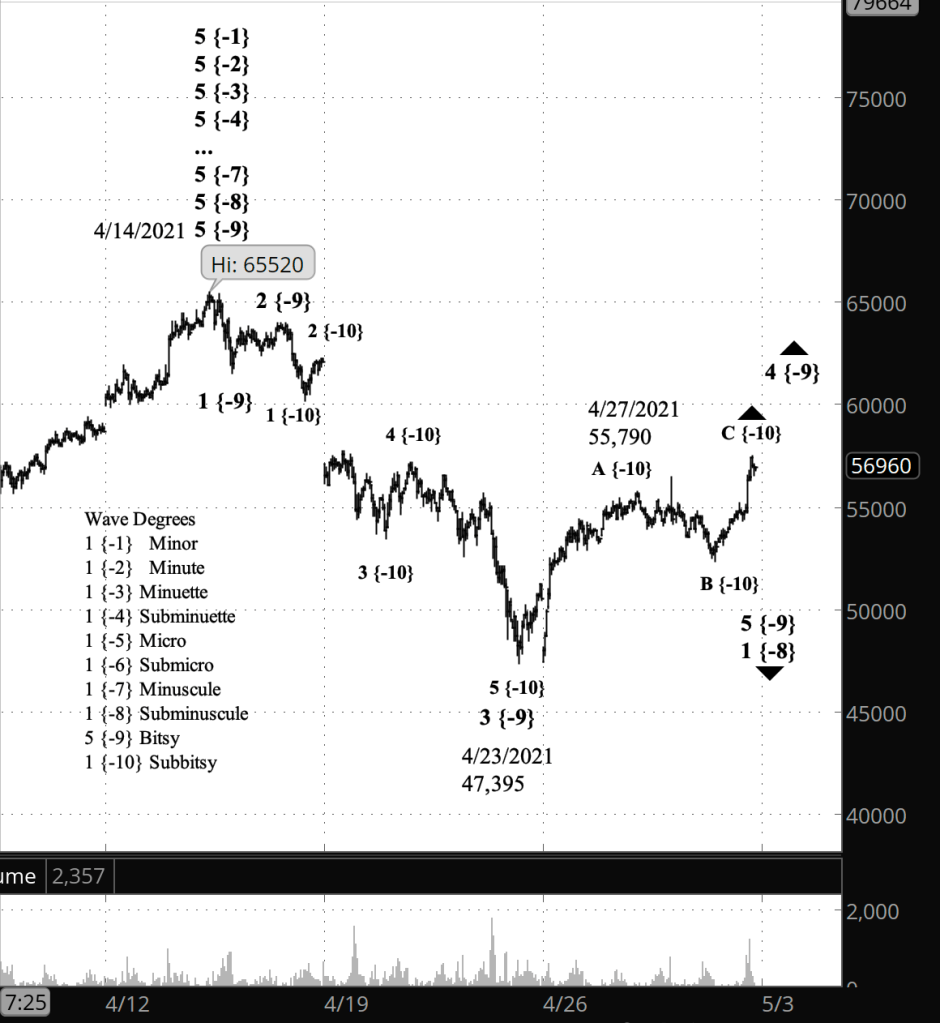
[Bitcoin futures at 2:15 p.m., 55-minute bars, with volume]
What does Elliott wave theory say? Bitcoin peaked on April 14 at 65,520, and a significant downtrend has begun. So far, the downtrend has completed waves 1 through 3 of Bitsy degree within wave 1 of Subminuscule degree and is dow in a 4th wave correction of Bitsy degree. Within the 4th wave, waves A and B of Subbitsy degree are complete and wave C is underway.
Half an hour before the closing bell. The S&P 500 continued downward, falling below Thursday’s low of 4168, to 4167.50 so far today. No change in the analysis. Chart updated.
9:40 a.m. New York time
What’s happening now? The S&P 500 e-mini futures resumed their downward movement after a rise that remained below the April 29 peak of 4211.
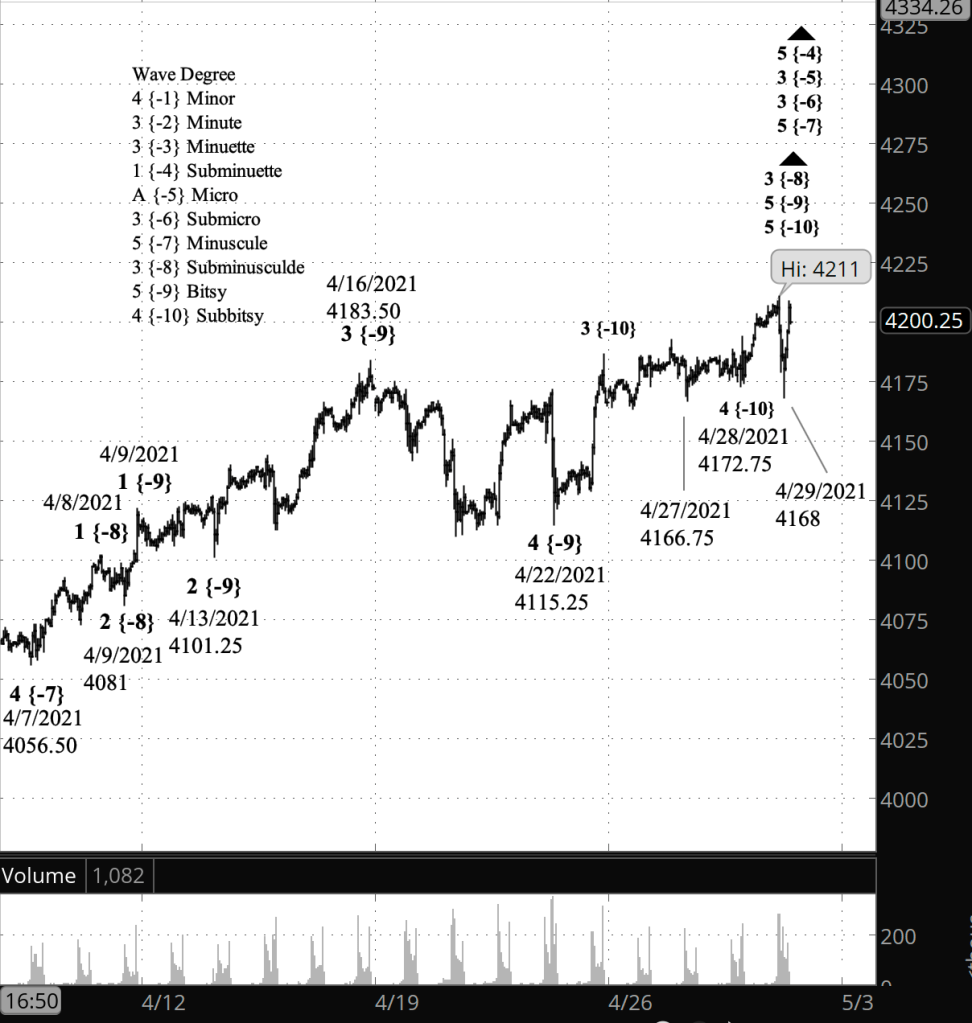
What does it mean? The failure to reach a new high suggests that 4211 marks the end of the rise that began on April 22 from 4115.25 and the beginning of a downward correction of the rise that began on April 9 from 4081.
What’s the alternative? The decline has yet to move below yesterday’s low of 4168, so it’s possible that the decline is a step within the rise that began on April 22. A move below 4168 will reduce the likelihood of this alternative analysis.
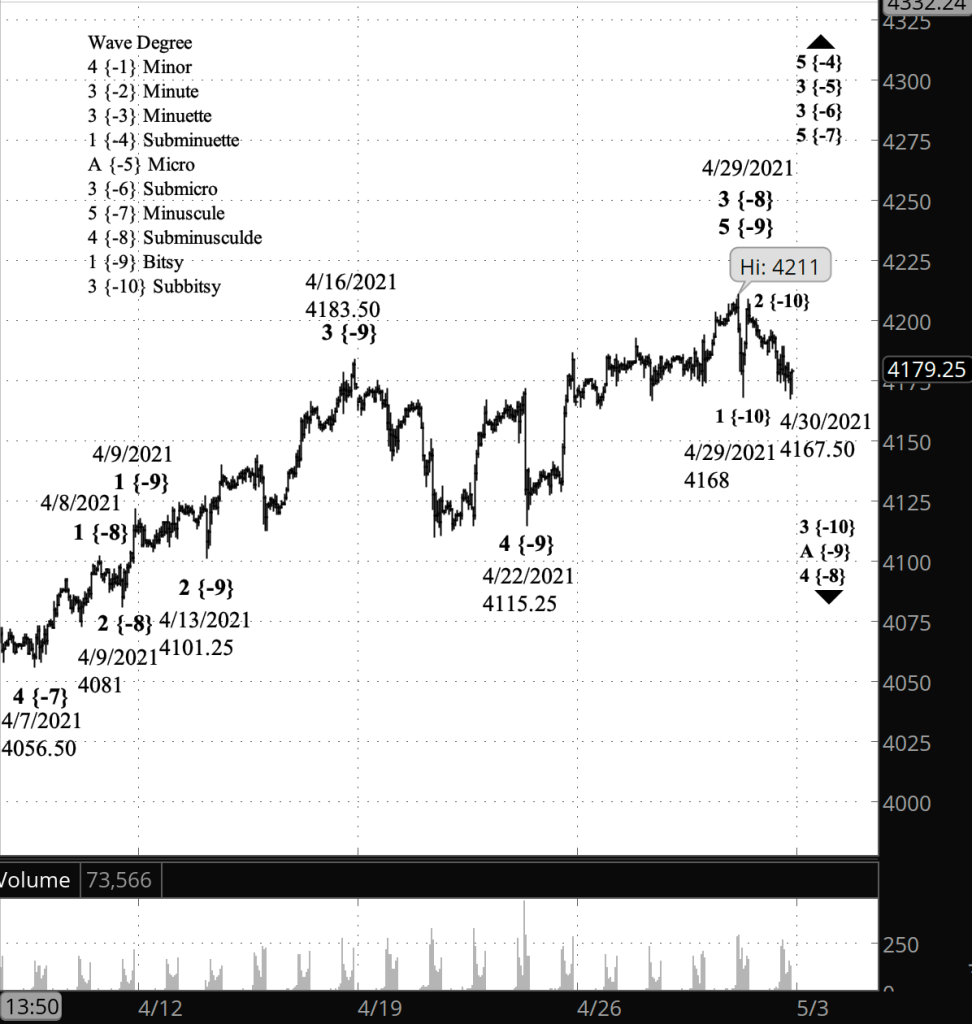
[S&P 500 E-mini futures at 3:30 p.m., 55-minute bars, with volume]
What does Elliott wave theory say? I’ve marked the chart according to the primary analysis, treating the high of April 29 as the end of wave 5 of Bitsy degree and also of the parent wave 3 of Subminuscule degree. The subsequent Subminuscule 4 correction is underway. Within Subminuscule 4, the decline in overnight trading was wave 1 of Subbitsy degree within wave A of Bitsy degree. If the Subminuscule 4 correction is taking the form of a Flat, then Bitsy wave A will have three waves internally at the Subbitsy level. If it is a Zigzag pattern, then Bitsy A will have five internal waves.
Half an hour before the closing bell. The S&P 500 E-mini futures, having risen to a new high in wave 5 of Subbitsy degree, dropped to below the take-off point of that 5th wave, opening the possibility that wave 5 is developing into a triangle structure. Here are the numbers that lie behind that suggestion:
–April 27, low point of a sideways Subbitsy wave 4, at 4166.75.
–April 28, end of Subbitsy 4 and beginning of Subbitsy 5, at 4172.75
–April 29, high so far of Subbitsy 5, at 4211
–April 29, the price drops to 4168, below the beginning of the 1st wave within Subbitsy wave 5.
That final drop, below the end Subbitsy 4 and the beginning of Subbitsy 5, is consistent with the beginning of a triangle. On the other hand, the final drop is above the low point of Subbitsy 4, so there’s ambiguity.
Alternatively, 4211 could be the end of Subbitsy 5, and the drop from the level could be the early stages of wave 1 within a wave 4 of Subminuscule degree.
We’ll see which analysis wins out as wave 5 develops. I’ve updated the chart, with the numbering based on an analysis that Subbitsy wave 5 is still underway.
10 a.m. New York time
Notethe new naming convention for the S&P 500 analyses that are the backbone of Private Trader. “SP500 Analysis” for the S&P 500 and its derivatives. Other analyses will also have the name or symbol of the product being analyzed, e.g., “Bitcoin Analysis” or “TSLA Analysis”. Analyses for a trade will be replace “Analysis” with “Trade”, as in “NIO Trade”.
What’s happening now? The S&P 500 E-mini futures rose sharply in overnight trading, to 4211 (4218.78 on the index). It is the final leg of the rise that began April 22 from 4115.25.
What does it mean? The late April rise is nearing completion and will be followed by shallow correction and then a further rise.
[S&P 500 E-mini futures at 3:30 p.m., 50-minute bars, with volume]
What does Elliott wave theory say? The overnight rise is wave 5 of Subbitsy degree within wave 5 of Bitsy degree within wave 3 of Subminuscule degree. There is no limit to how high a 5th wave can go, beyond the tendency to be proportional to the degree of which it is a part. Subminuscule wave 3 began on April 9 from 4081 and in 20 days has covered 130 points. A 4th wave correction of Subminuscule degree, if it takes the form of a Flat, which is usually, tends to have an end point within the 4th wave of Bitsy degree — one degree smaller — within the preceding Subminuscule 3rd wave. The would give us a correction target between 4115.25 and 4183.50. The further rise after Subminuscule wave 4 will be wave 5 of Subminuscule degree, which could carry the price a good distance higher.
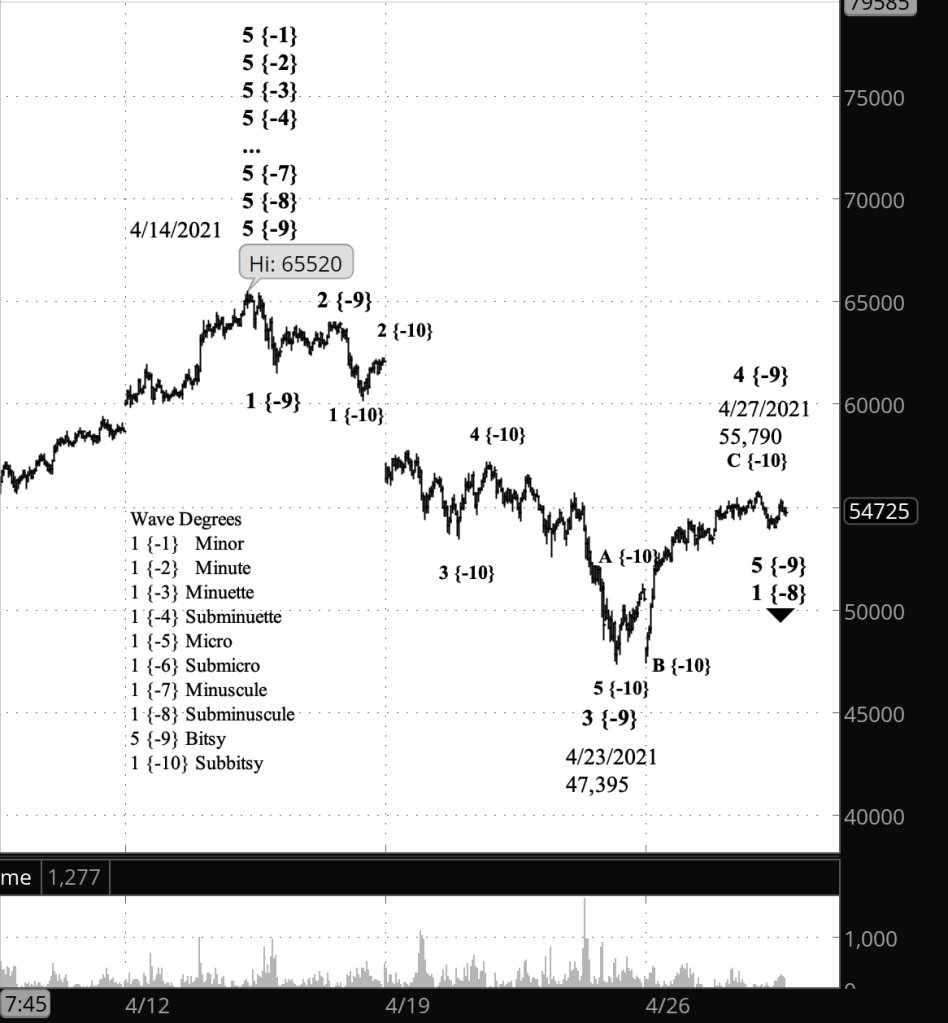
What’s happening now? Bitcoin continues to trade below yesterday’s peak of 55,790 in what appears to be a correction within the the rise that began April 23.
What does it mean? The upward correction, if it is in fact complete, will be followed by a resumption of the downtrend that began on April 14 from 65,520.
What’s the alternative? Yesterday’s peak may in fact not be the end of the rise from April 23, although the rise has met the basic requirements of Elliott wave analysis.
[Bitcoin futures at 10:35 a.m., 45-minute bars, with volume]
What does Elliott wave theory say? The April 14 peak appears to be the start of a major trend reversal, with the new downtrend in its early stages: Wave 1 of Subminuscule degree. Within that degree, the price has just completed or is about to complete wave C of Subbitsy degree within wave 4 of Bitsy degree. The upward 4th wave correction is being (or will be) followed by a Bitsy 5th wave movement downward.


You must be logged in to post a comment.