3:30 p.m. New York time
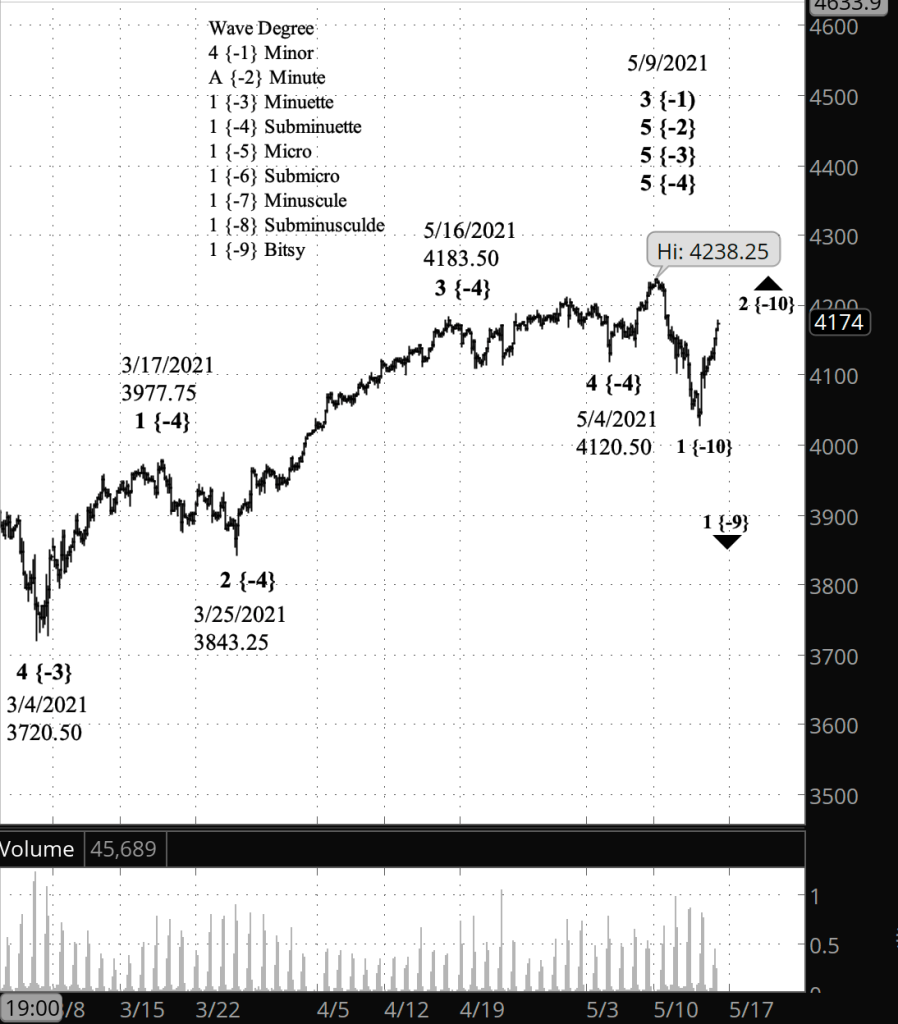
Half an hour before the closing bell. The S&P 500 rose through the day, as wave C within wave 2 of Subbitsy degree continued. No change in the analysis. Chart updated.
10 a.m. New York time
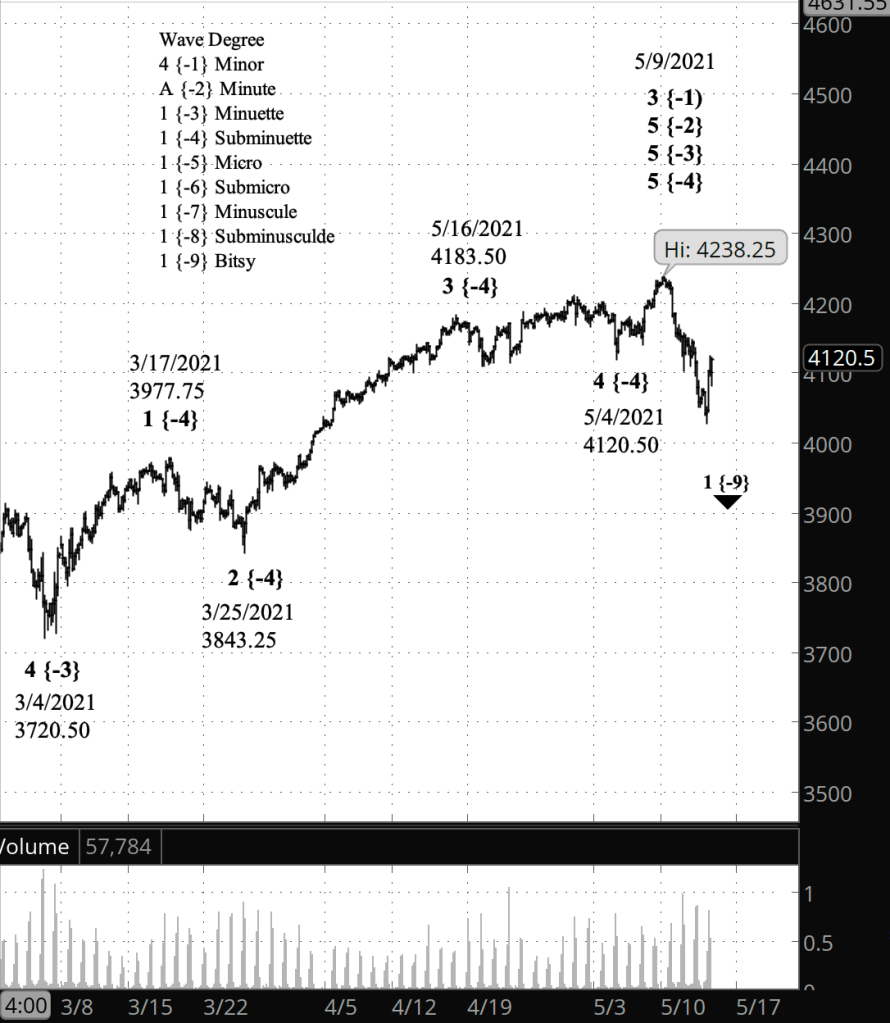
What’s happening now? The S&P 500 E-mini futures continued to rise in overnight trading, reaching a high so far today of 4135.
What does it mean? Continuation of the rise situates the S&P 500 in the middle wave of a three-wave correction to the upside.
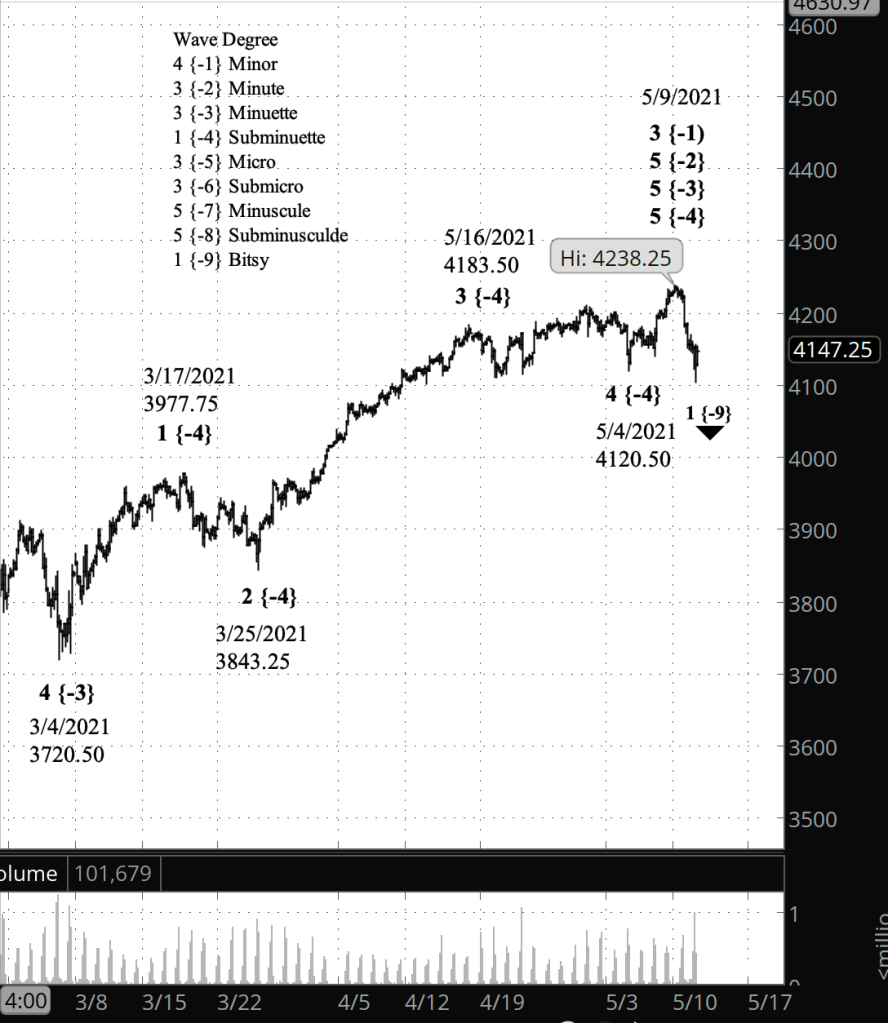
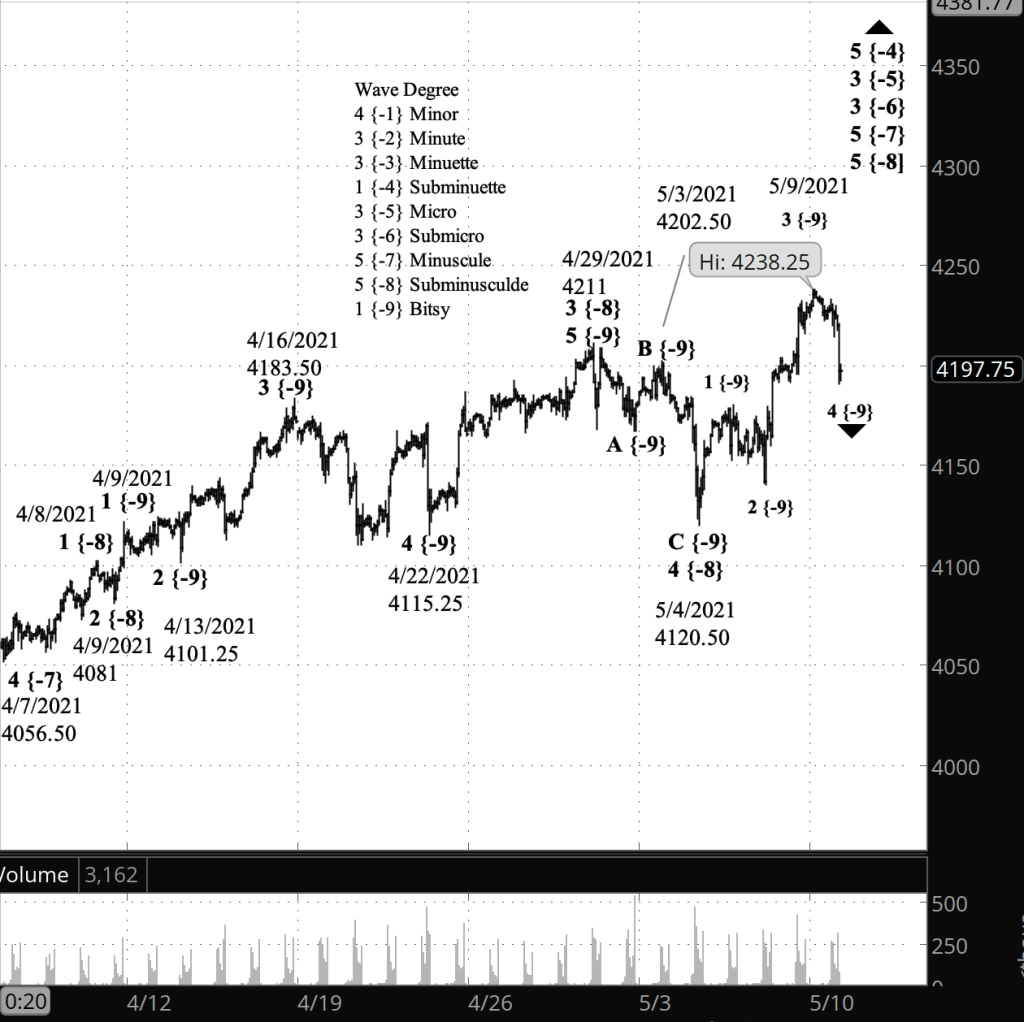
What’s the alternative? If the price should rise above the May 9 high of 4238.25, then the decline that ended on May 13 was a downward correction and the rise that began on months earlier is continuing.
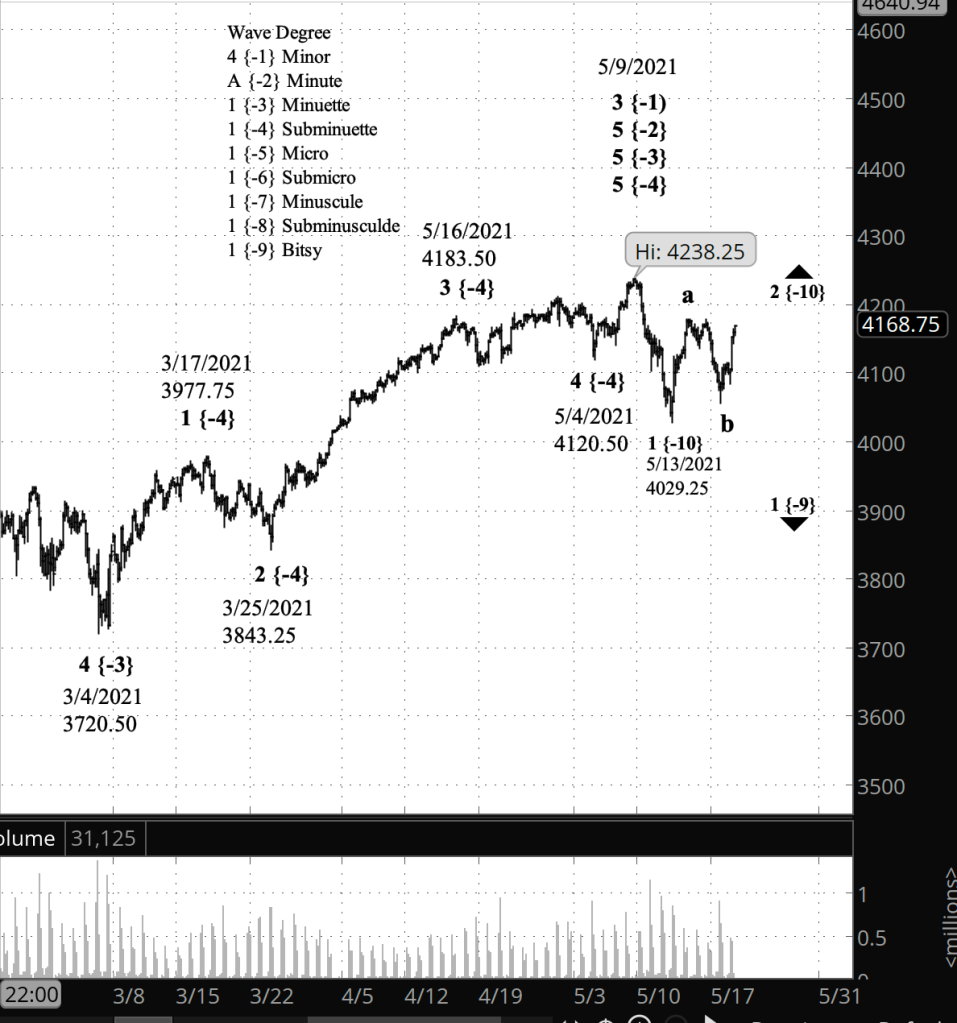
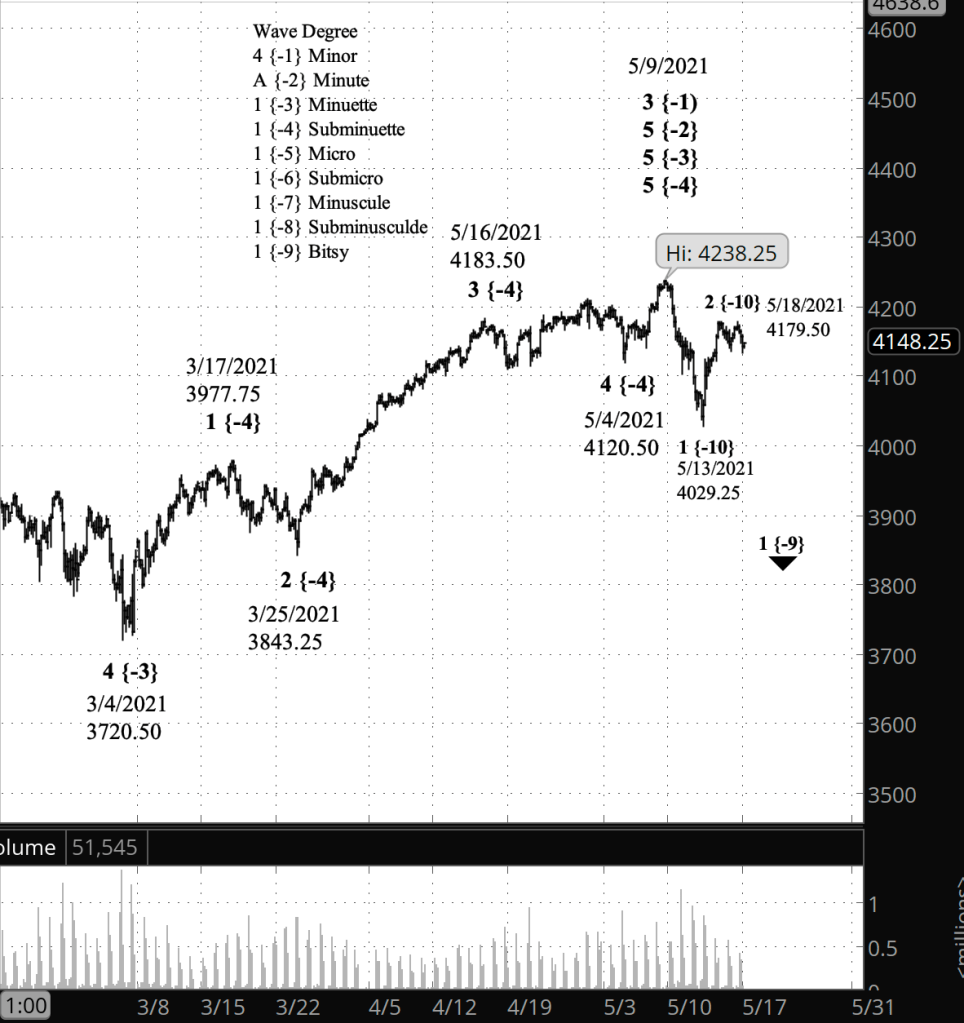
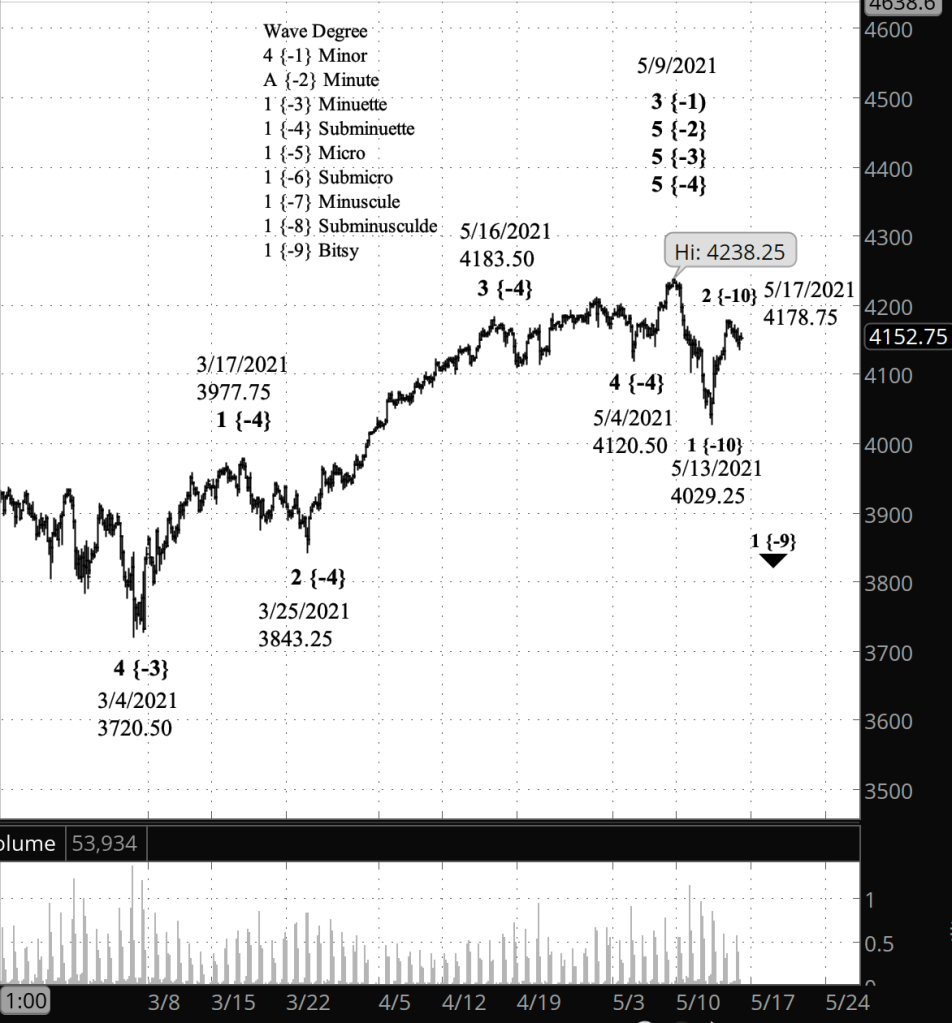
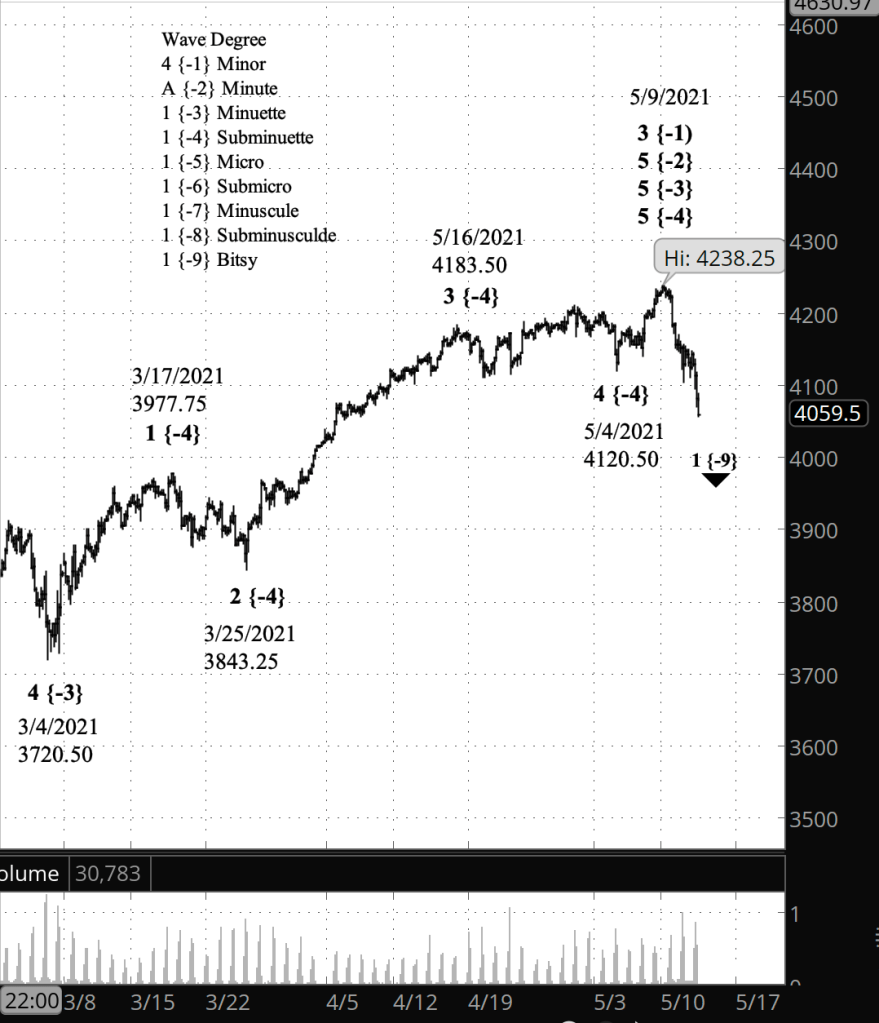
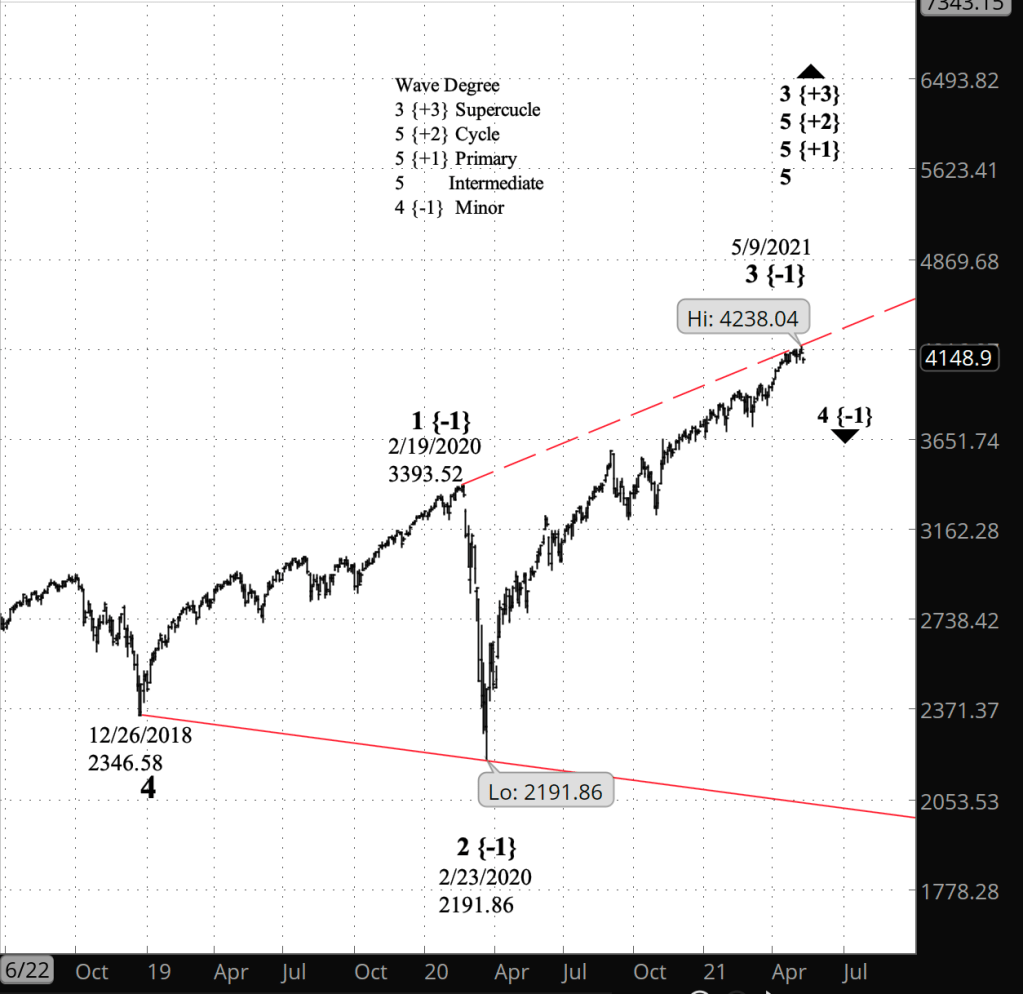
What does Elliott wave theory say? By my principle analysis, the wave 2 of Subbitsy degree correction that began on May 13 has completed its first internal wave A to the upside and its second, wave B to to the downside. The present rise is wave C to the upside. Second waves typically are simple Zigzags, so the completion of wave C will likely end Subbitsy wave 2 and mark the start of Subbitsy wave 3, an energetic move to the downside. This is all happening within the 1st wave of Bitsy degree and higher, the first tentative steps of a significant downtrend.
By my alternative analysis, the decline that began on May 9 is a continuation of a 4th wave correction within wave 5 of Minuette degree, which began on March 4.
Read More »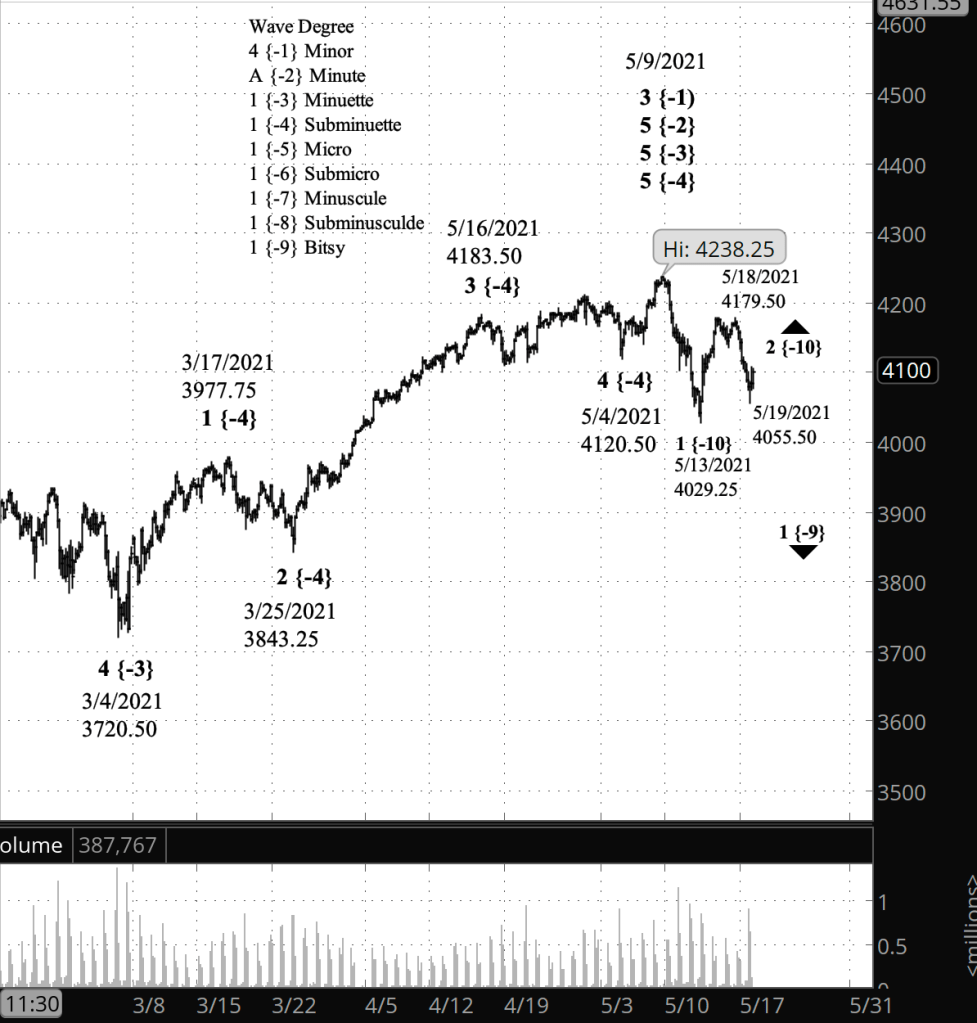


You must be logged in to post a comment.