10:15 a.m. New York time
No change this morning in my chart analysis of my positions in SPY and ARKG.
I am content to let events play out and see no need for trades out at this point.
By Tim Bovee, Portland, Oregon, June 28, 2018
11:20 a.m. New York time
SPY bumped up a bit today in what would appear to be, in Elliott wave analysis, a 4th wave of the Micro degree {-2}.
ARKG continues its downward course, having traced a very low level mini-correction to the upside over the last few days.
In neither case do I see a need for action, and I anticipate no trades today.
By Tim Bovee, Portland, Oregon, June 27, 2018
10:50 a.m. New York time
No changes in my analysis of my positions in SPY and ARKG. I anticipate no trades today.
The Fisher Transform for SPY is downtrending on both the daily and and weekly charts, and uptrending on my often unmentioned companion trade in SPXU, the inverse leveraged fund tracking SPY. Both trends are in the profitable direction.
The Fisher for ARKG has moved to downtrending on the daily chart, the unprofitable direction, although on the weekly chart it remains profitably uptrending. My focus is on the weekly for this long-term shares trade,
By Tim Bovee, Portland, Oregon, June 26, 2018
Update 8/14/2018: I exited SPY for a loss 50 days after entering the bear position and three days before the options expired. My exit price was a $7.79 debit with shares at $283.82, for a net loss of $3.99. The maximum risk at entry was $4.20, so I came in $0.21 shy of the worst case scenario.
My entry on June 25 was based on an Elliott wave analysis that showed wave 1 of Minute degree {+1} pushing downward. Elliott has its blind spots. The technique won’t tell duration, nor will tell magnitude. It is a “You Are Here” sign pointing to our location in the Elliott wave progression. Absent duration, we can’t say for sure when the situation will change, and absent magnitude, we can’t say how dramatic that change will be.
As the 60-day chart SPY chart, with hourly bars, shows, the change happened soon after entry, and was a filled with drama.
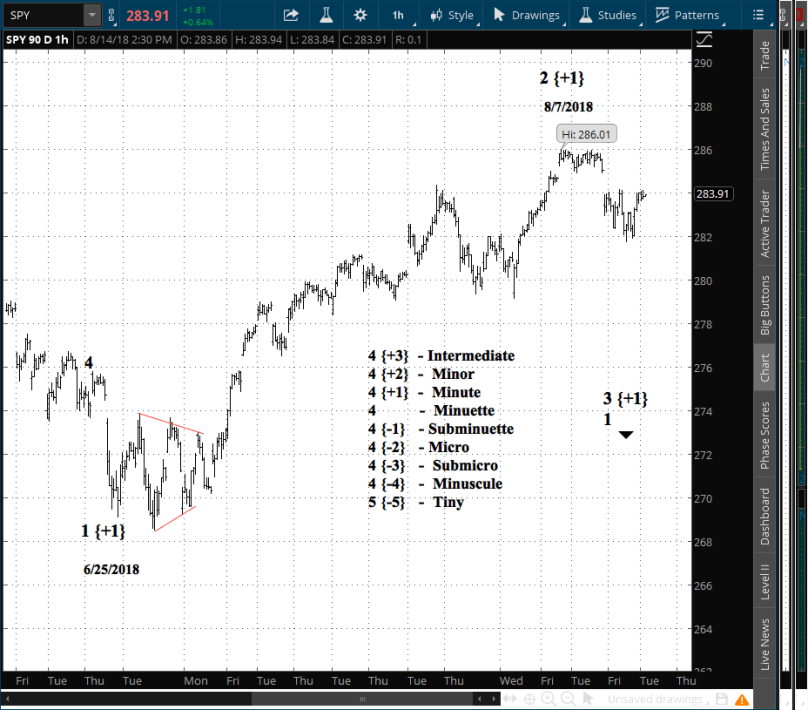
In a bear position like this one, a rise is the equivalent of falling off a cliff. SPY fell off a cliff about a week after I entered the position, and dramatic fall it was, beginning swiftly and then moderating before my position hit bottom and bounced.
It’s close to being the worst imaginable scenario. But that’s why I hedge my positions. My maximum loss is known when I enter the position, and it’s a loss I’m willing take, otherwise I wouldn’t have placed the trade.
The results:
SPY rose by 4.9% over my 50-day holding period, for a +36% annual rate. The options position produced a 51.2% loss for a -374% annual rate.
Going forward, the 3rd wave to the downside at the Minuette degree has begun, and I shall re-enter a bearish position on SPY very soon.
I have entered a short vertical spread on SPY, using options that trade for the last time 53 days hence, on Aug. 17. The premium is a $3.80 credit and the stock at the time of entry was priced at $270.52.
I made the decision to enter the trade in my account based on an Elliott wave count showing the 3rd wave down of Minuette degree began on June 13.
3:05 p.m. New York time
I entered one new position today, an options bear play on SPY. Despite a sharp decline, I decided to hold my shares bull play on ARKG.
1:15 p.m. New York time
I’ve entered a bear call vertical spread position on SPY.
12:30 p.m. New York time
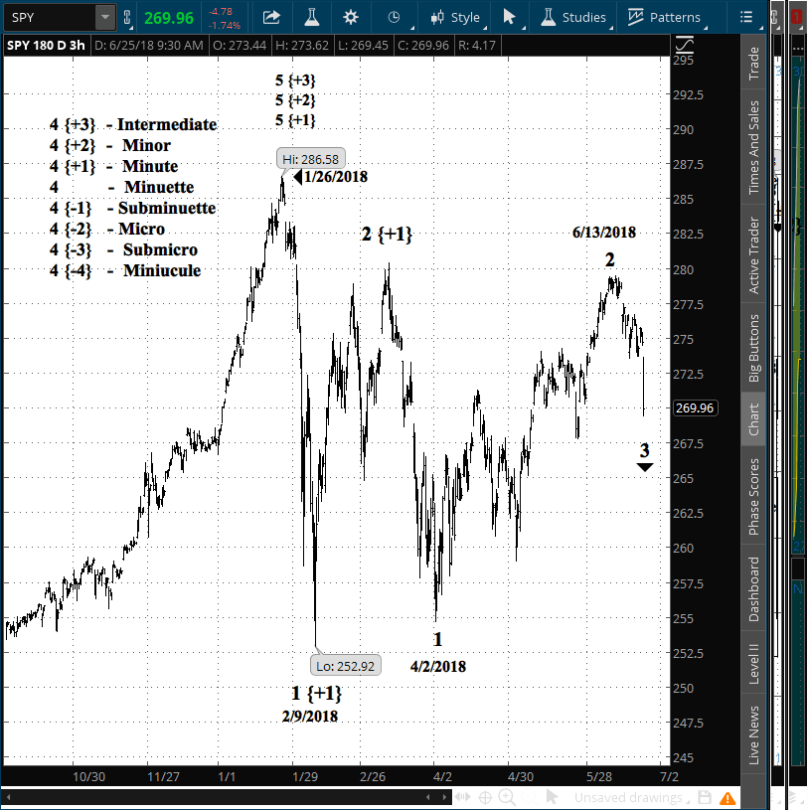
I had said in an earlier post that I was uncertain of my assignment of degrees to waves in my SPY analysis. The picture has become clearer, and I have redone the charts.
First, the longer term, a 180-day chart with daily bars. It shows the 3rd wave of the Minuette degree having begun on June 13.
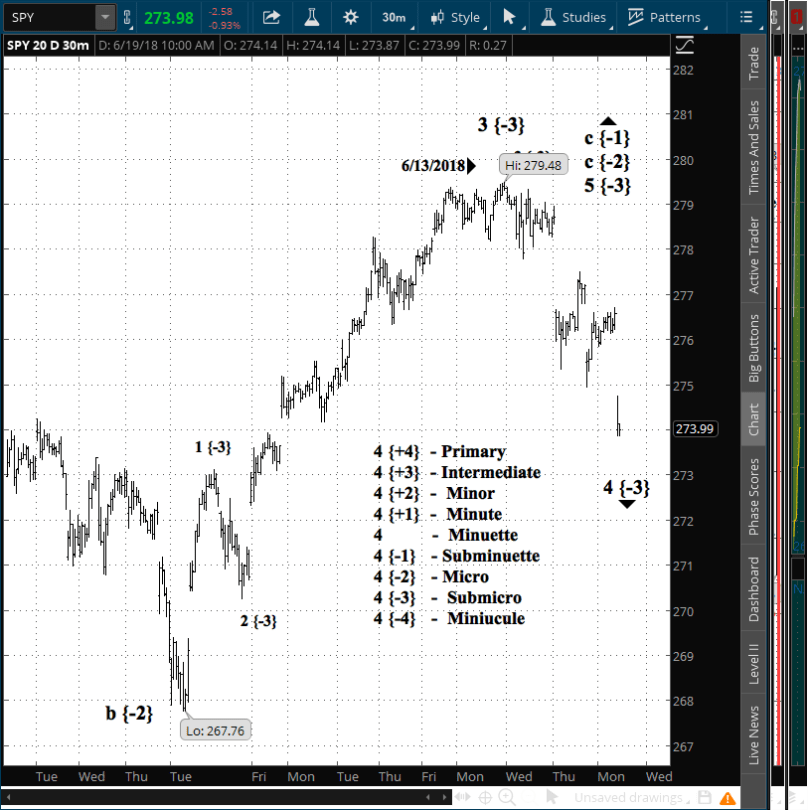
The shorter term chart, a 20-day span with hourly bars, shows that the decline is a 3rd wave at lower degrees as well, down at least as far as the Micro degree {-2}, at which point I stopped diving.

Bottom line: I can re-establish my bear call spread options series on SPY, and shall do so today.
11 a.m. New York time
Elliott wave analysis of ARKG shows the 3rd wave of Minor degree {+2} has ended its upward course, and the 4th wave of that degree has begun, from June 21. The movement is within the context of the 3rd wave of Intermediate degree {+3}, which in turn is within the 5th wave of Primary degree {+4) that began in mid-November 2017.
The chart spans 90 days with three-hour bars

From the outset I positioned ARKG as a longer-term trade. It’s a shares position rather than options, and so there are no expirations to worry about. My goal is to trade the Primary degree {+4}, although since I’m trading counter the trend of the broader market, I may out of caution lower that to the Intermediate degree {+3}.
Since the present decline is one degree smaller, the Minor degree {+2}, I see no need to trade out at this point.
10:20 a.m. New York time
SPY gapped to the downside at the open, and my other holding, ARKG, gave a powerful push downward.
The direction on both is consistent with my prior analysis, but given the power of the movements, I shall redo the charts to see if my model needs to be revised.
For the moment I see no trades today, but that could change. I shall post the charts later today.
By Tim Bovee, Portland, Oregon, June 25, 2018

The week brings a third and final look at 1st quarter gross domestic product, on Wednesday at 8:30 a.m. New York time.
The 2nd estimate, released last month, showed GDP increasing by an annual rate of 2.2% during the 1st quarter, down from 2.9% in the prior quarter. The quarter saw the second straight decline since a peak in the 3rd quarter of 2017.
Personal income and outlays on Friday at 8:30 a.m., showing how much we make, how much of that we spend, and through the mathematical magic of subtraction, how much of that we’re setting aside for other purposes, such as savings and investment.
A month ago income was rose from the prior month at a 3.6% annualized rate, outlays by a 7.2% annualized rate. Bottom line: We’re spending more than we make at a fairly good clip.
Three other major reports hit the Street during the week:
In Fedworld, Federal Reserve Vice Chairman Randal Quarles addresses the Utah Bankers Association on Wednesday at 11 a.m. New York time (9 a.m. local) at Sun Valley, Idaho. His subject: “International Regulatory Participation and Cooperation”. The event will streamed live here.
9:55 a.m. New York time
SPY is trading within yesterday’s range so far this morning and requires no action.
ARKG has set a lower low for two days in a a row for the first time since June 4, and the daily chart Fisher Transform has switched to downtrending. It has been uptrending since June 13. The weekly chart Fisher remains uptrending, as it has been since mid-May. The weekly is my chosen signal to consider exiting to avoid a downtrend.
Neither symbol demands a change in my Elliott wave count, so I see no reason to take action on either today.
On Saturday, look for The Week Ahead — my discussion of what to expect in economic reporting.
By Tim Bovee, Portland, Oregon, June 22, 2018
9:50 a.m. New York time
No significant change in my positions. I plan no trades today unless conditions change.
By Tim Bovee, Portland, Oregon, June 21, 2018
10:10 a.m. New York time
My Elliott wave analysis of SPY and ARKG still stand, and there has been no change in the Fisher Transform directional signals on either. I anticipate no trades today.
By Tim Bovee, Portland, Oregon, June 20, 2018
10:10 a.m. New York time
SPY has opened with a downward gap as the 4th wave down of the Submicro degree continues, Elliott wave analysis shows. The 3rd wave peaked on June 13 at 279.48. As of this writing SPY is trading at $274.40, which is 1.8% below that peak.
The market talk-talk is blaming the accelerating U.S.-China trade war for the decline. In the broader context of the chart, it’s a very small response, and one consistent with the pre-existing trend. So, “Balderdash!”, I say.
The low significance of the fall is buttressed by the Fisher Transform, which is unchanged: Downtrending on the daily chart and uptrending on the weekly chart.
The chart covers 20 days with 30-minute bars.
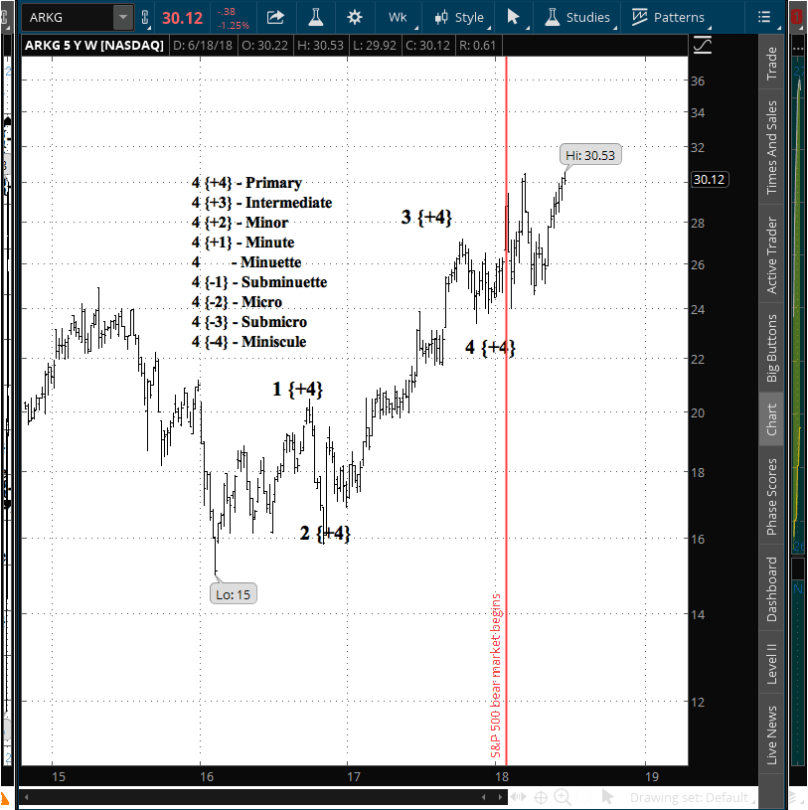
My shares position on ARKG continues to tick-tock along a rising 5th wave of the Primary degree. It has fulfilled all of the requirements for that wave and so could reverse into a correction without doing damage to the analysis. It could also continue to rise for some time. The daily and weekly Fishers remain uptrending.
The chart covers a 5-year span with one-week bars. The beginning of the bear market, on Jan. 26, is marked with a red line.
In either case, at this point I see no need for a trade today
By Tim Bovee, Portland, Oregon, June 19, 2018


You must be logged in to post a comment.