I did my analyses and entry trades earlier than usual today. I shall be breaking away from the markets early to meet a commitment. The stocks analyzed are DG and ORCL. Earlier in the day I exited IONS for a profit.
I prefer to enter positions nearer to the closing bell, and especially on those days when the Federal Open Market Committee makes an announcement. I feel comfortable rushing it today because the markets have priced in a 95% chance that the fed will raise its target rate from 0.75% to 1%. Not much room for surprises.
The market’s pricing in of Fed action came from a tool posted by the derivatives markets company the CME Group.
On March 13 I opened a shares position on IEF (see the analysis here), based on Elliott Wave analysis indications of a reversal to the upside. To multiply potential profits from the position, I am adding an call options play structured as a diagonal spread, a close substitute for the covered call stock-options combination.
I shall use the APR series of options for the short leg, which trades for the last time 38 days hence, on April 21, and the JUN series for the long leg, which ends trading 94 days from now, on June 16.
I’ve not often used this structure, so here are the rules I’ll be using, based on those prevalent at Tastry Trade, whose trading strategies are very similar to my own. The Tasty Trade description of diagonals can be found here. Here’s what I shall be looking at:
Update 4/5/2017: I have exited SNAP at 17% of its maximum potential profit, someone below my 25% profit. Why the early exit?
Many, perhaps most, non-directional trades eventually become directional, and that’s what has happened with SNAP since I entered my volatility play. For directional analysis, I turn to Elliott wave analysis.
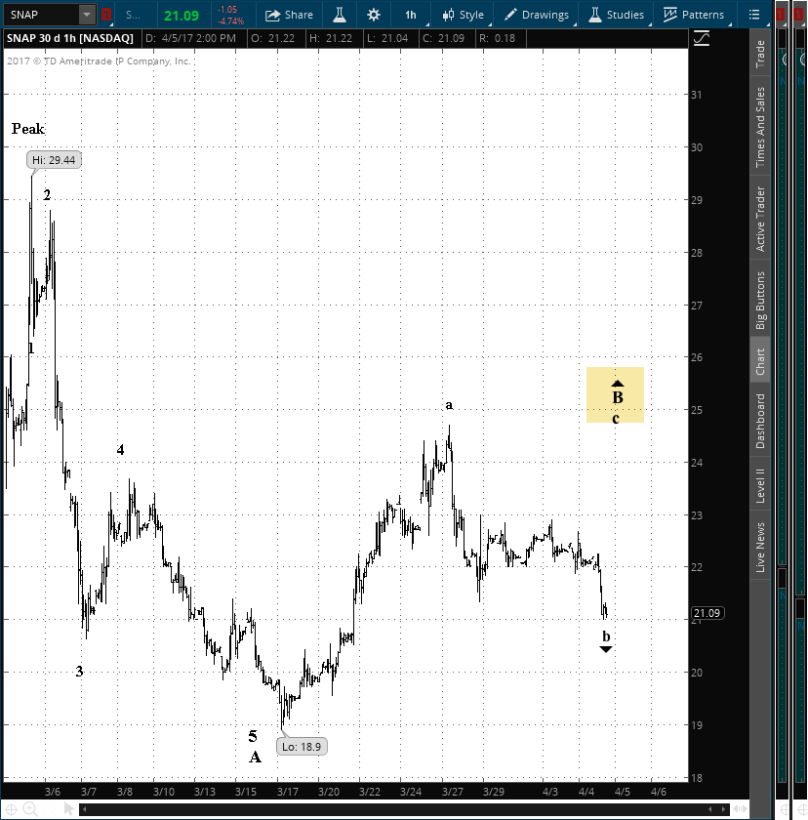
SNAP 30 days hourly bars
SNAP has been traded only since March 2, so the analysis will of necessity be both piecemeal and short term. After the IPO the price shot upward and then began a decline in the standard three-wave pattern identified in Elliott as a corrective wave.
So far SNAP shows an A wave to the downside composed of five subwaves and is now tracing a B wave to the upside. It is on the second, or “b”, subwave of that movement. Afterward, it will resume its rise in a wave c of the larger scale B wave, as noted in the yellow rectangle on the chart.
I exited because wave b of B has already retraced more than half of the wave a of B rise, well satisfying the form requirement of Elliott wave analysis. I judged that evidence pointed toward an upside move sooner rather than later, and so I judged it more prudent to take the profit, thereby eliminating the risk.
Shares rose by 3.5% over 23 days, or a 56% annual rate. The options position produced a 20.2% yield on debit for a +321% annual rate
SNAP is in its ninth day of trading since its initial public offering, with the stock price showing the usual post-IPO instability.
Today is the third day that options have traded. The are quite liquid — no surprise for such a high profile offering — and today implied volatility is at the peak of the symbol’s short history and at a very high level compared to the the benchmark VIX.
I shall use the APR series of options, which trades for the last time 38 days hence, on April 21.
Implied volatility stands at 51%, which is 4.1 times the VIX, a measure of the volatility of the S&P 500 index.
SNAP’s IV stands in the 98th percentile its most recent broad movement.
I entered two positions, on SNAP and IEF. I exited two positions, MYL and SGMS, each for a profit.
I have placed an exit order on IONS, but it has yet to be filled and appears unlikely to be. Nonetheless, I shall leave it active and shall update the live feed after the closing bell if it should indeed be executed.
3/14 – 12:28 p.m. New York time
I managed two positions, exiting them below my usual target of 25% of maximum profit in order to free up space in my account for other trades. Also, given the undeniable reality that time itself is risk, getting out early preserves my profits from events in an unknowable future.
The two exits were from options positions on MYL and SGMS; I shall update their analyses with results prior to the closing bell. I am attempting an early exit from IONS, so far without success.
I have entered a longer-term share position in IEF, an exchange-traded fund based on 7- and 10-year U.S. Treasuries.
I based the trade on Elliott Wave analysis that suggests that an end to the 5-wave price decline from the July peak of $114. The analysis, under Elliott Wave theory, suggests a large retracement to the upside. The fund pays a monthly dividend at present prices and rates of 1.82% annually.
Basically, it’s a good parking spot for unused funds, providing some dividend income and the chance of capital gains.
A two-day Federal Open Market Committee meeting, with forecasts and a news conference by Fed Chair Janet Yellen, will dominate market thinking the first half the week, and responses the second half. The money policy announcement and release of the forecasts is scheduled for Wednesday at 2 p.m. New York time, with Yellen’s news conference happening at 2:30 p.m.
The high number of jobs created in have persuaded market prognosticators that the central bank will raise interest rates. But of course, only the Fedsters know for sure.
Fittingly, two inflation measures will be released before the FOMC announcement: The producer price index on Tuesday and the consumer price index on Wednesday, each at 8:30 a.m.
Other major reports: Retail sales, also on Wednesday at 8:30 a.m., housing starts on Thursday at 8:30 a.m. and industrial production on Friday at 9:15 a.m.
Update 3/10/2017: PAY’s implied volatility declined sharply after earnings came in at about half of the Street estimate. I exited at 25% of maximum potential profit the day after entering the position.
Shares declined by 3.9% over a day, or a -1,408% annual rate. The options position produced a 33.3% yield on debit for a +12,167% annual rate.
PAY publishes earnings on Thursday, March 9, after the closing bell.
I shall use the APR series of options, which trades for the last time 43 days hence, on April 21.
Implied volatility stands at 45%, which is 3.6 times the VIX, a measure of the volatility of the S&P 500 index.
PAY’s IV stands in the 46th percentile of its annual range and the 89th percentile of its most recent broad movement.

You must be logged in to post a comment.