Options Trades 1/29/2024: XSP

Symbols traded: XSP (1DTE)

I entered a short Iron Fly position on XSP, one day prior to expiration, with the goal of exiting early on expiration day. I exited as planned, for a 15.5% loss, which wasn’t part of the plan.

XSP short Iron Fly

LOT:5ENTRY DATE:1/29/2024
EXIT DATE:1/30/2024
DAYS HELD:1

Entry and Exit

METRICCREDITDEBITCHANGECHANGE %ANNUALIZED CHANGE %
Options premium$ 1.74$ 2.06$ (0.32)-15.5%-5639%
METRICENTRYEXITCHANGECHANGE %ANNUALIZED CHANGE %
Stock price$ 489.98$ 492.02$ (2.04)0.42%152%
Impllied Volatility Rate10.212.11.9
Days to expiration10

The structure of the position

STRUCTURESTRIKEODDS EXPIRE OTMDELTAIN PRICEOUT PRICENET PRICE
Calls
Long493.0086.0%14$ (0.20)$ 0.49$ 0.29
Break-even491.7468.0%32
Short490.0050.0%50$ 1.12$ (2.40)$ (1.28)
Puts
Short490.0050.0%50$ 1.12$ (0.25)$ 0.87
Break-even488.7466.5%34
Long487.0083.0%18$ (0.29)$ 0.10$ (0.19)
======
`NET TOTAL:$ (0.31)

Risk and Reward

Per contract:
Reward174.00
Risk126.00
R/R Ratio (n:1)0.7

By Tim Bovee, Portland, Oregon, January 29-30, 2024

Disclaimer

Tim Bovee, Private Trader tracks the analysis and trades of a private trader for his own accounts. Nothing in this blog constitutes a recommendation to buy or sell stocks, options or any other financial instrument. The only purpose of this blog is to provide education and entertainment.

No trader is ever 100 percent successful in his or her trades. Trading in the stock and option markets is risky and uncertain. Each trader must make trading decisions for his or her own account, and take responsibility for the consequences.

License
Creative Commons License

All content on Tim Bovee, Private Trader by Timothy K. Bovee is licensed under a Creative Commons Attribution-ShareAlike 4.0 International License.

Based on a work at www.timbovee.com.

Trader’s Notebook

3:30 p.m. New York time

Half an hour before the closing bell. The S&P 500 rose to a new high during the session, in the 4950s so far, thereby confirming the principal analysis. A low degree 5th-wave uptrend that began on January 24 nearing its end.

When complete, it will cascade up the fractal structure, ending a series of progressively larger uptrends until it reaches a 3rd wave four degrees higher, which will end, and a 4th-wave downward correction of significant size will begin.

I’ve updated the chart.

3 p.m. New York time

Trades. One exit, one entry, both on derivatives of the S&P 500, both short-term trades designed to take advantage of volatility decline that is seen just prior to expiration.

I exited a 3DTE position on SPY, which included the weekend, for a 23.5% profit, and have updated the trade analysis with full data on the results.

I entered a 1DTE position on XSP, with the intention of exiting the next day, which is expiration day, and have posted a trade analysis.

9:35 a.m. New York time

What’s happening now? The S&P 500 E-mini futures traded sideways over night, with an initial decline followed by a recovery that together carried the price nowhere.

What does it mean? The low-degree 5th-wave uptrend that began on January 24 continues and is working through its 5th and final subwave. When that small subwave is complete, it will travel up the fractal structure of the chart, also ending three levels of waves of increasing size, and will also the the 3rd wave four degrees higher.

On the chart that 3rd wave is labeled as wave 3{-2}. The {-2} is a subscript showing the degree relative to others in the structure. Wave 3{-2} began on October 27, 2023. The small 5th-wave uptrend that will trigger it all it is wave 5{-6}.

Wave 3{-2} will be followed by a 4th-wave downward correction — wave 4{-2} — that will last for months.

What does the week ahead look like? In Elliott Wave Theory, the social mood drives the patterns waves make. Events are a small part — sometimes a large part — of that social mood. And the week will be rich with major events: On Wednesday, the Federal Open Market Committee will make a decision on interest rates: Lower them or leave them the same, or even raise them again. Wednesday will also see release of preview, the ADP report, of Friday’s Employment Situation Report, the latter being a major component when judging the state of the economy.

What are the alternatives? And the events of the week, as they impact the social mood, may well, at last clarify the great ambiguity that has been with us during the present low-degree uptrend. The alternative interpretation, also of high likelihood, sees the price movement from January 24 as a 4th wave, the next-to-the last subwave within the larger uptrending 5th wave. It will take a decisive move to the upside to resolve the ambiguity.

[S&P 500 E-mini futures at 3:30 p.m., 40-minute bars, with volume]

What does Elliott wave theory say? Here are the waves that underly the analyses.

Principal Analysis:

  • Wave 5{0}, an expanding Diagonal Triangle, began on December 26, 2018.
  • Within it, an uptrend, wave 5{-1}, began on October 13, 2022 and is underway.
  • Wave 5{-1} is the parent wave of a uptrend, wave 3{-2}, that began on October 25, 2023 and is in wave 5{-3}, the last of five subwaves.
  • Wave 5{-3} is in turn in its last subwave, wave 5{-4}, which is also in its final subwave, wave 5{-5}.
  • When wave 5{-5} is complete, it will also be the end of waves 5{-4}, 5{-3} and 3{-2}, and a downward correction, wave 4{-2}, will begin.
  • At a very small degree — hours rather than days — wave 5{-6} is underway.

Alternative Analysis:

  • At a very small degree, wave 4{-6}, a downward correction, has entered its middle subwave, rising wave B{-7}.

We Are Here.

These are the waves currently in progress under my principal analysis. Each line on the list shows the wave number, with the subscript in curly brackets, the traditional degree name, the starting date, the starting price of the S&P 500 E-mini futures, and the direction of the wave.

  • S&P 500 Index:
  • 5{+3} Supercycle, 7/8/1932, 4.40 (up)
  • 5{+2} Cycle, 12/9/1974, 60.96 (up)
  • 5{+1} Primary, 3/6/2009, 666.79 (up)
  • 5{0} Intermediate, 12/26/2018, 2346.58 (up)
  • S&P 500 Futures and index:
  • 5{-1} Minor, 10/13/2022, 3502 (up) (futures), 3491.58 (up) (index)
  • S&P 500 Futures:
  • 3{-2} Minute, 10/27/2023, 4143.50 (up)
  • 5{-3} Minuette, 10/27/2023, 4143.50 (up)

Reading the chart. Price movements — waves – – in Elliott wave analysis are labeled with numbers within trending waves and letters with corrective waves. The subscripts — numbers in curly brackets — designate the wave’s degree, which, in Elliott wave analysis, means the relative position of a wave within the larger and smaller structures that make up the chart. R.N. Elliott, who in the 1930s developed the form of analysis that bears his name, viewed the chart as a complex structure of smaller waves nested within larger waves, which in turn are nested within still larger waves. In mathematics it’s called a fractal structure, where at every scale the pattern is similar to the others.

Learning and other resources. Elliott wave analysis provides context, not prophecy. As the 20th century semanticist Alfred Korzybski put it in his book Science and Sanity (1933), “The map is not the territory … The only usefulness of a map depends on similarity of structure between the empirical world and the map.” And I would add, in the ever-changing markets, we can judge that similarity of structure only after the fact.

See the menu page Analytical Methods for a rundown on where to go for information on Elliott wave analysis.

By Tim Bovee, Portland, Oregon, January 29, 2024

Disclaimer

Tim Bovee, Private Trader tracks the analysis and trades of a private trader for his own accounts. Nothing in this blog constitutes a recommendation to buy or sell stocks, options or any other financial instrument. The only purpose of this blog is to provide education and entertainment.

No trader is ever 100 percent successful in his or her trades. Trading in the stock and option markets is risky and uncertain. Each trader must make trading decisions for his or her own account, and take responsibility for the consequences.

License
Creative Commons License

All content on Tim Bovee, Private Trader by Timothy K. Bovee is licensed under a Creative Commons Attribution-ShareAlike 4.0 International License.

Based on a work at www.timbovee.com.

Options Trades 1/26/2024: SPY

Symbols traded: A short Iron Fly on SPY (3DTE)

I entered the short-term position with the intent of holding it over the weekend and exiting on Monday, January 29, which expiration day. I exited on expiration day for a 23.5% profit.

SPY short Iron Fly

LOT:5ENTRY DATE:1/26/2024
EXIT DATE:1/29/2024
DAYS HELD:3

Entry and Exit

METRICCREDITDEBITCHANGECHANGE %ANNUALIZED CHANGE %
Options premium$ 2.00$ 1.62$ 0.3823.5%2838%
METRICENTRYEXITCHANGECHANGE %ANNUALIZED CHANGE %
Stock price$ 487.50$ 487.66$ (0.16)0.03%4%
Impllied Volatility Rate9.510.20.7
Days to expiration30

The structure of the position

STRUCTURESTRIKEODDS EXPIRE OTMDELTAIN PRICEOUT PRICENET PRICE
Calls
Long490.0077.0%22$ (0.45)$ 0.15$ (0.30)
Break-even489.0061.0%37.5
Short487.0045.0%53$ 1.65$ (1.24)$ 0.41
Puts
Short487.0047.0%56$ 1.09$ (0.61)$ 0.48
Break-even486.0066.0%36
Long484.0085.0%16$ (0.29)$ 0.08$ (0.21)
======
`NET TOTAL:$ 0.38

Risk and Reward

Per contract:
Reward200.00
Risk100.00
R/R Ratio (n:1)0.5

By Tim Bovee, Portland, Oregon, January 26-29, 2024

Disclaimer

Tim Bovee, Private Trader tracks the analysis and trades of a private trader for his own accounts. Nothing in this blog constitutes a recommendation to buy or sell stocks, options or any other financial instrument. The only purpose of this blog is to provide education and entertainment.

No trader is ever 100 percent successful in his or her trades. Trading in the stock and option markets is risky and uncertain. Each trader must make trading decisions for his or her own account, and take responsibility for the consequences.

License
Creative Commons License

All content on Tim Bovee, Private Trader by Timothy K. Bovee is licensed under a Creative Commons Attribution-ShareAlike 4.0 International License.

Based on a work at www.timbovee.com.

Trader’s Notebook

3:30 p.m. New York time

Half an hour before the closing bell. The S&P 500 futures moved higher during the session, to a peak of 4934.25, and then pulled back slightly. The new high gives this morning’s principal analysis an edge over the alternative analysis. It is more likely that the rise that began on January 23 is in its 5th and final subwave. The alternative, that a 4th subwave downward correction is underway, has proven to be less likely. I’ve updated the chart.

2:10 p.m. New York time

Trades. I’ve exited my longer-term short Iron Condor position on IWM with 21 days to expiration, which I entered on January 12, or 35 days to expiration. For longer-term positions, 21 DTE is my standard management day, when I exit profitable positions and figure out what to do with the unprofitable ones. The IWM positions produced a 21.3% profit. I’ve updated the trade analysis with results.

I entered a short-term position on SPY, structured as a short Iron Fly, with goal of holding it over the weekend and exiting on Monday, January 29, shortly after the opening bell. I’ve posted a trade analysis.

9:35 a.m. New York time

What’s happening now? The S&P 500 E-mini futures slowly worked its way higher with a series of ups and downs that have reached a few points above the prior days high.

What does it mean? The upward tilt, no mater how slight, increases the likelihood that the rise that began on January 24 is a 5th wave, the final subwave within a larger uptrending 5th wave that began on January 5.

What are the alternatives? The alternative interpretation, also of high likelihood, sees the price movement from January 24 as a 4th wave, the next-to-the last subwave within the larger uptrending 5th wave. [Note: The afternoon analysis makes this alternative less likely.]

[S&P 500 E-mini futures at 3:30 p.m., 40-minute bars, with volume]

What does Elliott wave theory say? Here are the waves that underly the analyses.

Principal Analysis:

  • Wave 5{0}, an expanding Diagonal Triangle, began on December 26, 2018.
  • Within it, an uptrend, wave 5{-1}, began on October 13, 2022 and is underway.
  • Wave 5{-1} is the parent wave of a uptrend, wave 3{-2}, that began on October 25, 2023 and is in wave 5{-3}, the last of five subwaves.
  • Wave 5{-3} is in turn in its last subwave, wave 5{-4}, which is also in its final subwave, wave 5{-5}.
  • When wave 5{-5} is complete, it will also be the end of waves 5{-4}, 5{-3} and 3{-2}, and a downward correction, wave 4{-2}, will begin.
  • At a very small degree — hours rather than days — wave 5{-6} has begun its rise.

Alternative Analysis

  • At a very small degree, wave 4{-6}, a downward correction, has entered its middle subwave, rising wave B{-7}. [Note: The afternoon analysis makes this alternative less likely.]

We Are Here.

These are the waves currently in progress under my principal analysis. Each line on the list shows the wave number, with the subscript in curly brackets, the traditional degree name, the starting date, the starting price of the S&P 500 E-mini futures, and the direction of the wave.

  • S&P 500 Index:
  • 5{+3} Supercycle, 7/8/1932, 4.40 (up)
  • 5{+2} Cycle, 12/9/1974, 60.96 (up)
  • 5{+1} Primary, 3/6/2009, 666.79 (up)
  • 5{0} Intermediate, 12/26/2018, 2346.58 (up)
  • S&P 500 Futures and index:
  • 5{-1} Minor, 10/13/2022, 3502 (up) (futures), 3491.58 (up) (index)
  • S&P 500 Futures:
  • 3{-2} Minute, 10/27/2023, 4143.50 (up)
  • 5{-3} Minuette, 10/27/2023, 4143.50 (up)

Reading the chart. Price movements — waves – – in Elliott wave analysis are labeled with numbers within trending waves and letters with corrective waves. The subscripts — numbers in curly brackets — designate the wave’s degree, which, in Elliott wave analysis, means the relative position of a wave within the larger and smaller structures that make up the chart. R.N. Elliott, who in the 1930s developed the form of analysis that bears his name, viewed the chart as a complex structure of smaller waves nested within larger waves, which in turn are nested within still larger waves. In mathematics it’s called a fractal structure, where at every scale the pattern is similar to the others.

Learning and other resources. Elliott wave analysis provides context, not prophecy. As the 20th century semanticist Alfred Korzybski put it in his book Science and Sanity (1933), “The map is not the territory … The only usefulness of a map depends on similarity of structure between the empirical world and the map.” And I would add, in the ever-changing markets, we can judge that similarity of structure only after the fact.

See the menu page Analytical Methods for a rundown on where to go for information on Elliott wave analysis.

By Tim Bovee, Portland, Oregon, January 26, 2024

Disclaimer

Tim Bovee, Private Trader tracks the analysis and trades of a private trader for his own accounts. Nothing in this blog constitutes a recommendation to buy or sell stocks, options or any other financial instrument. The only purpose of this blog is to provide education and entertainment.

No trader is ever 100 percent successful in his or her trades. Trading in the stock and option markets is risky and uncertain. Each trader must make trading decisions for his or her own account, and take responsibility for the consequences.

License
Creative Commons License

All content on Tim Bovee, Private Trader by Timothy K. Bovee is licensed under a Creative Commons Attribution-ShareAlike 4.0 International License.

Based on a work at www.timbovee.com.

Trader’s Notebook

3:30 p.m. New York time

Half an hour before the closing bell. The S&P 500 futures declined during the session, so far never reaching the prior day’s high, 4933.25, and remaining above the prior day’s low, 4889.

Meaning that that the ambiguity described this morning remains. Two possible interpretations of what’s happening within the 5th-wave uptrend that began on January 5:

  • The 5th subwave scenario: The larger uptrend is in its final leg, wave 5, also uptrending.
  • The 4th subwave scenario: The larger uptrend is in its next-to-the-last leg, wave 4, a downward correction.

I’ve updated the chart

9:35 a.m. New York time

What’s happening now? The S&P 500 E-mini futures rose sharply after new GDP numbers came in better than expected.

What does it mean? The final subwave, Elliott wave 5, continues, within a larger 5th-wave uptrend that began on January 5. The rise is either the resumption of the uptrend or a continuation of the 4th-wave downward correction that brought the price lower late in yesterday’s session.

I’ve marked the chart to show the 5th-wave scenario. The two scenarios — 5th-wave beginning or 4th-wave continuation, are equally likely at this point. A price rise above the January 24 high, 4933.25, would confirm the 5th-wave beginning scenario. A drop below 4889, the overnight low, would confirm the 4th-wave continuation.

In either case, a much larger 3rd-wave uptrend that began on October 27, 2023 continues and is working through its end game. It will be followed by a large 4th-wave downward correction..

What are the alternatives? As noted above, there is some ambiguity about what wave of small degree the overnight rise represents, a rising 5th wave or the rising middle subwave, wave B, within a 4th-wave downward correction.

Also, There is rarely clarity about the degrees in relation to a fixed level. For example, is wave 5{-3} on the chart really at degree {-3}, or should it be {-4}? There’s no way to know for sure.

[S&P 500 E-mini futures at 3:30 p.m., 35-minute bars, with volume]

What does Elliott wave theory say? Here are the waves that underly the analyses.

Principal Analysis:

  • Wave 5{0}, an expanding Diagonal Triangle, began on December 26, 2018.
  • Within it, an uptrend, wave 5{-1}, began on October 13, 2022 and is underway.
  • Wave 5{-1} is the parent wave of a uptrend, wave 3{-2}, that began on October 25, 2023 and is in wave 5{-3}, the last of five subwaves.
  • Wave 5{-3} is in turn in its last subwave, wave 5{-4}, which is also in its final subwave, wave 5{-5}.
  • When wave 5{-5} is complete, it will also be the end of waves 5{-4}, 5{-3} and 3{-2}, and a downward correction, wave 4{-2}, will begin.
  • At a very small degree — hours rather than days — wave 5{-6} has begun its rise.

Alternative Analysis #1:

  • At a very small degree, wave 4{-6}, a downward correction, has entered its middle subwave, rising wave B{-7}.

Alternative Analysis #2:

  • The subwaves of wave 3{-2} could be one degree lower. For example, wave 5{-3} could really be wave 5{-4}, with the other subwaves’ degrees lower by one.

We Are Here.

These are the waves currently in progress under my principal analysis. Each line on the list shows the wave number, with the subscript in curly brackets, the traditional degree name, the starting date, the starting price of the S&P 500 E-mini futures, and the direction of the wave.

  • S&P 500 Index:
  • 5{+3} Supercycle, 7/8/1932, 4.40 (up)
  • 5{+2} Cycle, 12/9/1974, 60.96 (up)
  • 5{+1} Primary, 3/6/2009, 666.79 (up)
  • 5{0} Intermediate, 12/26/2018, 2346.58 (up)
  • S&P 500 Futures and index:
  • 5{-1} Minor, 10/13/2022, 3502 (up) (futures), 3491.58 (up) (index)
  • S&P 500 Futures:
  • 3{-2} Minute, 10/27/2023, 4143.50 (up)
  • 5{-3} Minuette, 10/27/2023, 4143.50 (up)

Reading the chart. Price movements — waves – – in Elliott wave analysis are labeled with numbers within trending waves and letters with corrective waves. The subscripts — numbers in curly brackets — designate the wave’s degree, which, in Elliott wave analysis, means the relative position of a wave within the larger and smaller structures that make up the chart. R.N. Elliott, who in the 1930s developed the form of analysis that bears his name, viewed the chart as a complex structure of smaller waves nested within larger waves, which in turn are nested within still larger waves. In mathematics it’s called a fractal structure, where at every scale the pattern is similar to the others.

Learning and other resources. Elliott wave analysis provides context, not prophecy. As the 20th century semanticist Alfred Korzybski put it in his book Science and Sanity (1933), “The map is not the territory … The only usefulness of a map depends on similarity of structure between the empirical world and the map.” And I would add, in the ever-changing markets, we can judge that similarity of structure only after the fact.

See the menu page Analytical Methods for a rundown on where to go for information on Elliott wave analysis.

By Tim Bovee, Portland, Oregon, January 25, 2024

Disclaimer

Tim Bovee, Private Trader tracks the analysis and trades of a private trader for his own accounts. Nothing in this blog constitutes a recommendation to buy or sell stocks, options or any other financial instrument. The only purpose of this blog is to provide education and entertainment.

No trader is ever 100 percent successful in his or her trades. Trading in the stock and option markets is risky and uncertain. Each trader must make trading decisions for his or her own account, and take responsibility for the consequences.

License
Creative Commons License

All content on Tim Bovee, Private Trader by Timothy K. Bovee is licensed under a Creative Commons Attribution-ShareAlike 4.0 International License.

Based on a work at www.timbovee.com.

Options Trades 1/24/2024: QQQ

Symbol traded: QQQ (9DTE)

I’ve entered a short bull put Vertical Spread on QQQ, based on Elliott Wave Analysis of the chart that shows that an uptrending 5th wave of low degree is underway. The position has a target of 50% of maximum potential profit.

The position expires on February 2, with a management date of January 29. On the management date, I either take any profit or decide how to handle a loss.

January 31, 2024: And I’m out, for a significant loss. The S&P 500 reversed after a truncated 5th wave uptrend, and that made this position no longer viable. I exited.

QQQ short bull put Vertical Spread

LOT:5ENTRY DATE:1/24/2024
EXIT DATE:1/31/2024
DAYS HELD:7

Entry and Exit

METRICCREDIT (ENTRY)DEBIT (EXIT)CHANGECHANGE %ANNUALIZED CHANGE %
Options premium$ 0.93$ 2.63$ (1.70)-64.6%-3352%
ENTRYEXITCHANGECHANGE %ANNUALIZED CHANGE %
Stock price$ 429.49$ 419.54$ (9.95)-2.3%-121%
Implied Volatility Rate8.919.410.5
Days to expiration92-7

The structure of the position

STRUCTURESTRIKEODDS EXPIRE OTMDELTAIN PRICEOUT PRICENET PRICE
Puts
Long418.0083.0%17(1.13)2.51$ 1.38
Break-even423.9377.5%22.5
Short423.0072.0%282.06(5.14)$ (3.08)
======
-1.70

Risk and Reward

Per contract:
Reward93.00
Risk593.00
R/R Ratio (n:1)6.4

By Tim Bovee, Portland, Oregon, January 24, 31, 2024

Disclaimer

Tim Bovee, Private Trader tracks the analysis and trades of a private trader for his own accounts. Nothing in this blog constitutes a recommendation to buy or sell stocks, options or any other financial instrument. The only purpose of this blog is to provide education and entertainment.

No trader is ever 100 percent successful in his or her trades. Trading in the stock and option markets is risky and uncertain. Each trader must make trading decisions for his or her own account, and take responsibility for the consequences.

License
Creative Commons License

All content on Tim Bovee, Private Trader by Timothy K. Bovee is licensed under a Creative Commons Attribution-ShareAlike 4.0 International License.

Based on a work at www.timbovee.com.

Trader’s Notebook

3:30 p.m. New York time

Half an hour before the closing bell. The S&P 500 futures peaked at 4933.25 during the session and then declined, approaching 4900 as the closing bell drew near. The rise and decline are part of a low-degree uptrending 5th wave that began on January 23.

I tentatively count the decline as being a 4th-wave downward correction within the larger uptrend. If the price again rises past the peak then my tentative count is a proper match for the chart. If the decline continues, then the odds increase that wave 5 ended at the session peak. The end of the preceding 1st wave, 4886.25, is the lowest the 4th wave can go under a rule of Elliott Wave Theory. A typical low point for a downward correction is the 4th subwave within the preceding 3rd wave: About where it is now.

I’ve updated the chart.

2:50 p.m. New York time

Trades. I exited by short bull put Vertical Spread on SPY, which I entered yesterday, for a 51% profit and have updated the trade analysis with results.

I entered a short bull put spread on QQQ and posted a trade analysis.

9:35 a.m. New York time

What’s happening now? The S&P 500 E-mini futures rose overnight from the around 4900 into the 4920s.

What does it mean? Using the model of Elliott Wave theory, a 3rd wave uptrend that began on October 27, 2023 is underway and is working through its end game. A subwave two levels lower within the fractal structure of the chart is an uptrending 5th wave within a larger 5th wave.

On the chart, each wave is numbered, and its degree — its placement within the fractal structure — is indicated by a number showing the distance from what in Elliott Wave Theory is called an Intermediate wave — in this case, wave 5{0}, which began on December 26, 2018.

The 3rd wave uptrend is wave 3{-2}. Within it, waves 5{-3}, 5{-4} and 5{-5}.

When the smallest of the set, wave 5{-5}, is complete, it will also mark the endpoint of waves 5{-4, 5{-3} and 3{-2}. A downward correction, wave 4{-2}, will follow. If it is typical of its degree, it will last for months.

What are the alternatives? There is rarely clarity about the degrees in relation to a fixed level. For example, is wave 5{-3} really at degree {-3}, or should it be {-4}? There’s no way to know for sure.

[S&P 500 E-mini futures at 3:30 p.m., 30-minute bars, with volume]

What does Elliott wave theory say? Here are the waves that underly the analyses.

Principal Analysis:

  • Wave 5{0}, an expanding Diagonal Triangle, began on December 26, 2018.
  • Within it, an uptrend, wave 5{-1}, began on October 13, 2022 and is underway.
  • Wave 5{-1} is the parent wave of a uptrend, wave 3{-2}, that began on October 25, 2023 and is in wave 5{-3}, the last of five subwaves.
  • Wave 5{-3} is in turn in its last subwave, wave 5{-4}. When wave 5{-4} is complete, it will also be the end of waves 5{-3} and 3{-2}, and a downward correction, wave 4{-4}, will begin.

We Are Here.

These are the waves currently in progress under my principal analysis. Each line on the list shows the wave number, with the subscript in curly brackets, the traditional degree name, the starting date, the starting price of the S&P 500 E-mini futures, and the direction of the wave.

  • S&P 500 Index:
  • 5{+3} Supercycle, 7/8/1932, 4.40 (up)
  • 5{+2} Cycle, 12/9/1974, 60.96 (up)
  • 5{+1} Primary, 3/6/2009, 666.79 (up)
  • 5{0} Intermediate, 12/26/2018, 2346.58 (up)
  • S&P 500 Futures and index:
  • 5{-1} Minor, 10/13/2022, 3502 (up) (futures), 3491.58 (up) (index)
  • S&P 500 Futures:
  • 3{-2} Minute, 10/27/2023, 4143.50 (up)

Reading the chart. Price movements — waves – – in Elliott wave analysis are labeled with numbers within trending waves and letters with corrective waves. The subscripts — numbers in curly brackets — designate the wave’s degree, which, in Elliott wave analysis, means the relative position of a wave within the larger and smaller structures that make up the chart. R.N. Elliott, who in the 1930s developed the form of analysis that bears his name, viewed the chart as a complex structure of smaller waves nested within larger waves, which in turn are nested within still larger waves. In mathematics it’s called a fractal structure, where at every scale the pattern is similar to the others.

Learning and other resources. Elliott wave analysis provides context, not prophecy. As the 20th century semanticist Alfred Korzybski put it in his book Science and Sanity (1933), “The map is not the territory … The only usefulness of a map depends on similarity of structure between the empirical world and the map.” And I would add, in the ever-changing markets, we can judge that similarity of structure only after the fact.

See the menu page Analytical Methods for a rundown on where to go for information on Elliott wave analysis.

By Tim Bovee, Portland, Oregon, January 24, 2024

Disclaimer

Tim Bovee, Private Trader tracks the analysis and trades of a private trader for his own accounts. Nothing in this blog constitutes a recommendation to buy or sell stocks, options or any other financial instrument. The only purpose of this blog is to provide education and entertainment.

No trader is ever 100 percent successful in his or her trades. Trading in the stock and option markets is risky and uncertain. Each trader must make trading decisions for his or her own account, and take responsibility for the consequences.

License
Creative Commons License

All content on Tim Bovee, Private Trader by Timothy K. Bovee is licensed under a Creative Commons Attribution-ShareAlike 4.0 International License.

Based on a work at www.timbovee.com.

Options Trades 1/23/2024: IBM SPY

Symbols traded today: IBM (17DTE), SPY (9DTE)

I entered two options positions today, using different strategies on each for different purposes.

The first, a short Iron Condor on IBM, is in response to the compan’s earnings announcement, on January 24 after the closing bell. I’ve positioned the short legs of the trade at a bit beyond the expected move, based on the options pricing. I chose the duration as a way of being close to enough to expiration to benefit from a rapid decline in implied volatility, and far enough away to have time for the price to reverse the whipsaw often seen after an event-driven price movement

The second, short bull put Vertical spread on SPY, based on my Elliott Wave Theory analysis of the S&P 500 chart, which shows price to be in a small-sized, largely sideways 4th wave downward correction that will be followed by a trending 5th wave push to the upside. I chose the short put strike based on the expected move, as indicated by the options pricing. The 9DTE duration has been shown, by a study conducted by the brokerage TastyTrade, to be less prone to event-driven spikes than other durations. The implied volatility is low, and that’s not exactly a good thing for this trading strategy. On the other hand, it’s SPY, which is based on the S&P 500, which I analyze every day the market is open. So, I’m going with it. Also, the risk/reward ratio is overly high. Because of the Elliott Wave analysis, I’m fairly sure it won’t come into play.

I exited SPY the next day at 54.6% of maximum potential profit. My goal for trades of this type is 50% of max.

IBM short Iron Condor

LOT:1ENTRY DATE:1/23/2024

Entry and Exit

METRICCREDIT
Options premium$ 1.39
METRICENTRY
Stock price$ 173.46
Impllied Volatility Rate65.4
Days to expiration9

The structure of the position

STRUCTURESTRIKEODDS EXPIRE OTMDELTAIN PRICE
Calls
Long187.5091.0%10$ (0.43)
Break-even183.8986.5%14.5
Short182.5082.0%19$ 1.06
Puts
Short165.0077.0%11$ 1.33
Break-even161.3983.0%10.5
Long160.0089.0%10$ (0.57)

Risk and Reward

Per contract:
Reward139.00
Risk361.00
R/R Ratio (n:1)2.6

SPY short Iron Condor

LOT:4ENTRY DATE:1/23/2024
EXIT DATE:1/24/2024
DAYS HELD:1

Entry and Exit

METRICCREDIT (ENTRY)DEBIT (EXIT)CHANGECHANGE %ANNUALIZED CHANGE %
Options premium$ 1.00$ 0.49$ 0.51104.1%37782%
ENTRYEXITCHANGECHANGE %ANNUALIZED CHANGE %
Stock price$ 483.92$ 487.58$ 3.660.8%276%
Implied Volatility Rate6.24.0-2.2
Days to expiration98-1

The structure of the position

STRUCTURESTRIKEODDS EXPIRE OTMDELTAIN PRICEOUT PRICENET PRICE
Puts
Long474.0086.0%14-0.710.32$ (0.39)
Break-even481.0078.0%22.5
Short480.0070.0%311.71-0.81$ 0.90
======
NET TOTAL:0.51

Risk and Reward

Per contract:
Reward108.00
Risk708.00
R/R Ratio (n:1)6.6

By Tim Bovee, Portland, Oregon, January 23-24, 2024

Disclaimer

Tim Bovee, Private Trader tracks the analysis and trades of a private trader for his own accounts. Nothing in this blog constitutes a recommendation to buy or sell stocks, options or any other financial instrument. The only purpose of this blog is to provide education and entertainment.

No trader is ever 100 percent successful in his or her trades. Trading in the stock and option markets is risky and uncertain. Each trader must make trading decisions for his or her own account, and take responsibility for the consequences.

License
Creative Commons License

All content on Tim Bovee, Private Trader by Timothy K. Bovee is licensed under a Creative Commons Attribution-ShareAlike 4.0 International License.

Based on a work at www.timbovee.com.

Trader’s Notebook

3:30 p.m. New York time

Half an hour before the closing bell. The S&P 500 futures remained between the 4870s and the 4890s during the session. The low-degree 4th-wave downward correction within a series of larger uptrends continues. I’ve updated the chart.

3 p.m. New York time

Trades. I’ve entered two options positions, using different strategies on each for different purposes.

The first, a short Iron Condor on IBM, is in response to the company’s earnings announcement, on January 24 after the closing bell. The second, a short bull put Vertical Spread, is on SPY, based on my Elliott Wave Theory analysis of the S&P 500 chart.

I’ve posted trade analyses of the two positions.

9:35 a.m. New York time

What’s happening now? The S&P 500 E-mini futures traded narrowly in the 4870s for most of the night, rising slightly into the 4890s as the opening bell approached and then declining sharply in the moments before the session began.

What does it mean? The 3rd-wave uptrend that began on January 5 has entered its 4th of five subwaves, a downward correction that will be followed by a final push to the upside that will end the 3rd wave and begin a larger 4th-wave downward correction. The decline overnight may well be the 3rd and final subwave of that 4th-wave downward correction.

This is all happening within a larger 5th-wave uptrend that began on September 27, 2023, which is in its final subwave. When that subwave is complete, it will mark the end of the parent wave, a 3rd-wave uptrend that began on October 25, 2023 and will trigger an even larger 4th-wave downward correction.

What are the alternatives? As always, there is rarely clarity about the degrees in relation to a fixed level. For example, is wave 5{-3} really at degree {-3}, or should it be {-4}? There’s no way to know for sure.

[S&P 500 E-mini futures at 3:30 p.m., 30-minute bars, with volume]

What does Elliott wave theory say? Here are the waves that underly the analyses.

Principal Analysis:

  • Wave 5{0}, an expanding Diagonal Triangle, began on December 26, 2018.
  • Within it, an uptrend, wave 5{-1}, began on October 13, 2022 and is underway.
  • Wave 5{-1} is the parent wave of a uptrend, wave 1{-2}, that began on October 25, 2023 and is in wave 3{-3}, the middle of five subwaves.
  • Wave 3{-3} is in turn in its last subwave, wave 5{-4}. When wave 5{-4} is complete, it will also be the end of wave 3{-3}, and a downward correction, wave 4{-3}, will begin.

Alternative analysis:

  • Wave 3{-3} in the principal analysis may be of a lower degree, wave 3{-4}, perhaps, or wave 3{-5}.

We Are Here.

These are the waves currently in progress under my principal analysis. Each line on the list shows the wave number, with the subscript in curly brackets, the traditional degree name, the starting date, the starting price of the S&P 500 E-mini futures, and the direction of the wave.

  • S&P 500 Index:
  • 5{+3} Supercycle, 7/8/1932, 4.40 (up)
  • 5{+2} Cycle, 12/9/1974, 60.96 (up)
  • 5{+1} Primary, 3/6/2009, 666.79 (up)
  • 5{0} Intermediate, 12/26/2018, 2346.58 (up)
  • S&P 500 Futures and index:
  • 5{-1} Minor, 10/13/2022, 3502 (up) (futures), 3491.58 (up) (index)
  • S&P 500 Futures:
  • 1{-2} Minute, 10/27/2023, 4143.50 (up)
  • 5{-3} Minuette, 10/27/2023, 4143.50 (up)

Reading the chart. Price movements — waves – – in Elliott wave analysis are labeled with numbers within trending waves and letters with corrective waves. The subscripts — numbers in curly brackets — designate the wave’s degree, which, in Elliott wave analysis, means the relative position of a wave within the larger and smaller structures that make up the chart. R.N. Elliott, who in the 1930s developed the form of analysis that bears his name, viewed the chart as a complex structure of smaller waves nested within larger waves, which in turn are nested within still larger waves. In mathematics it’s called a fractal structure, where at every scale the pattern is similar to the others.

Learning and other resources. Elliott wave analysis provides context, not prophecy. As the 20th century semanticist Alfred Korzybski put it in his book Science and Sanity (1933), “The map is not the territory … The only usefulness of a map depends on similarity of structure between the empirical world and the map.” And I would add, in the ever-changing markets, we can judge that similarity of structure only after the fact.

See the menu page Analytical Methods for a rundown on where to go for information on Elliott wave analysis.

By Tim Bovee, Portland, Oregon, January 23, 2024

Disclaimer

Tim Bovee, Private Trader tracks the analysis and trades of a private trader for his own accounts. Nothing in this blog constitutes a recommendation to buy or sell stocks, options or any other financial instrument. The only purpose of this blog is to provide education and entertainment.

No trader is ever 100 percent successful in his or her trades. Trading in the stock and option markets is risky and uncertain. Each trader must make trading decisions for his or her own account, and take responsibility for the consequences.

License
Creative Commons License

All content on Tim Bovee, Private Trader by Timothy K. Bovee is licensed under a Creative Commons Attribution-ShareAlike 4.0 International License.

Based on a work at www.timbovee.com.

Trader’s Notebook

3:30 p.m. New York time

Half an hour before the closing bell. The S&P 500 futures traded narrowly during the session, fluctuating from the 4970s to the 4990s.

A low-degree 4th-wave downward correction within wave 3{-5} may have begun, although the degree of the pause is not yet entirely clear.

This morning’s analysis is unchanged. I’ve updated the upper chart.

2:15 p.m. New York time

Trades. I exited two short Iron Fly positions that I held over the weekend, QQQ and SPY. Each produced a loss.

The market changed course in a major way from the time of entry to the time of exit. In terms of Elliott Wave Theory, I entered under an upward correction within a long-running downtrend, and I exited under an uptrend within a long-running larger uptrend.

The S&P 500 is trending up under both analysis. The difference is one of confidence, confidence impacts volatility, and volatility often plays a starring role in determining whether an options positions produces a profit or a loss.

QQQ went to a 4.4% loss, and SPY, for a 16% loss.

I didn’t enter any positions today, as I think through how to change my strategy. Generally, among trades held for a shorter time, things go better with lower volatilities. I’m thinking 0DTE or 1DTE trades. For a slight longer holding period — a 9DTE position, for example — I tend to go for a short Iron Condor and a higher volatility.

Or it could be that since the S&P 500 is in a 5th-wave uptrend, a pure directional play would do best, which means short Vertical Spreads, given the rules that guide my traders.

I’ve updated the QQQ and SPY trade analyses with results.

9:35 a.m. New York time

What’s happening now? The S&P 500 E-mini futures rose into the 4890s after trading resumed overnight, continuing to set record highs

What does it mean? The 3rd-wave uptrend that that began on October 13, 2022 continues and is in its 3rd subwave. Internally, that 3rd wave is in its 5th subwave, which in turn is in its middle subwave, all uptrending.

In broader sense, the futures are just beginning to rise. Closer to where we are today, a rise is nearing its end, and a downward correction willl\ follow.

When we left the S&P 500 on Friday, the price had broken a rule of Elliott Wave Theory. The rules says that if a 2nd wave moves beyond the start of the preceding wave, it’s not a 2nd wave. Instead, something else is going on.

I’ve spent a large part of the weekend a quest for that something else. The following is a renewed Elliott Wave analysis that has drawn a new map of terrain, which on Friday no longer matched the old map.

In the discussion that follows I use wave numbers, each followed by subscript, in curly brackets, showing its position within the fractal hierarchy of the chart. R.N. Elliott, who developed the theory that bears his name, called such a position a degree within the hierarchy. For more, see the “Reading the Chart” section below.

Here’s how I’ve changed my analysis:

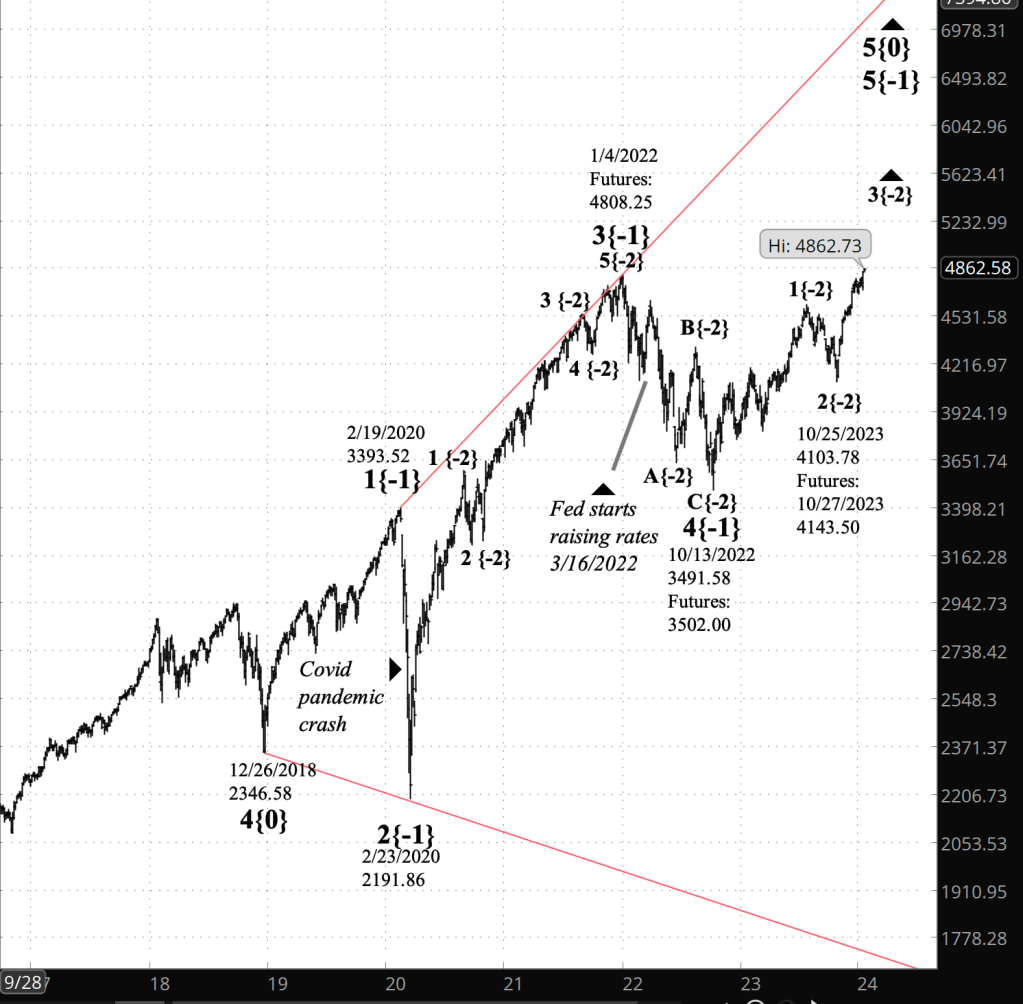
My starting point was the January 4, 2022 peak, which until Friday was highest point the S&P 500 had ever reached. In both the old and new analyses, it is labeled wave 3{-1}, the third of five subwaves within an expanding Diagonal Triangle, wave 5{0}, that began on December 26, 2018

From that peak the price fell, reaching a reversal point on October 13, 2022. The old chart had labeled that point as the end of a subwave, wave 1{-2}. The new analysis makes it the end of a three-wave downward correction, wave 4{-1}.

In order to avoid the violation of Elliott Wave Theory rules, the rise that began on October 13, 2023 couldn’t be an upward correction. The price had risen above starting point of the decline that began on January 4, 2022, and so the rise had to be a trending impulse wave, with five subwaves.

That was the key decision in the reanalysis. It was the problem solver. Once that change was in place, it was simply a matter of labeling subwaves within wave 4{-1} and within the uptrending wave that follows, wave 5{-1}, which is still in progress.

Wave 5{-1} by my count is in wave 1{-2}, the first of five subwaves. Wave 1{-2}, in turn, is in its fifth and final subwave, wave 5{-3}, which began on October 27, 2023.

What are the alternatives?

Alternative #1: As always, there is rarely clarity about the degrees in relation to a fixed level. For example, is wave 5{-3} really at degree {-3}, or should it be {-4}? There’s no way to say for sure.

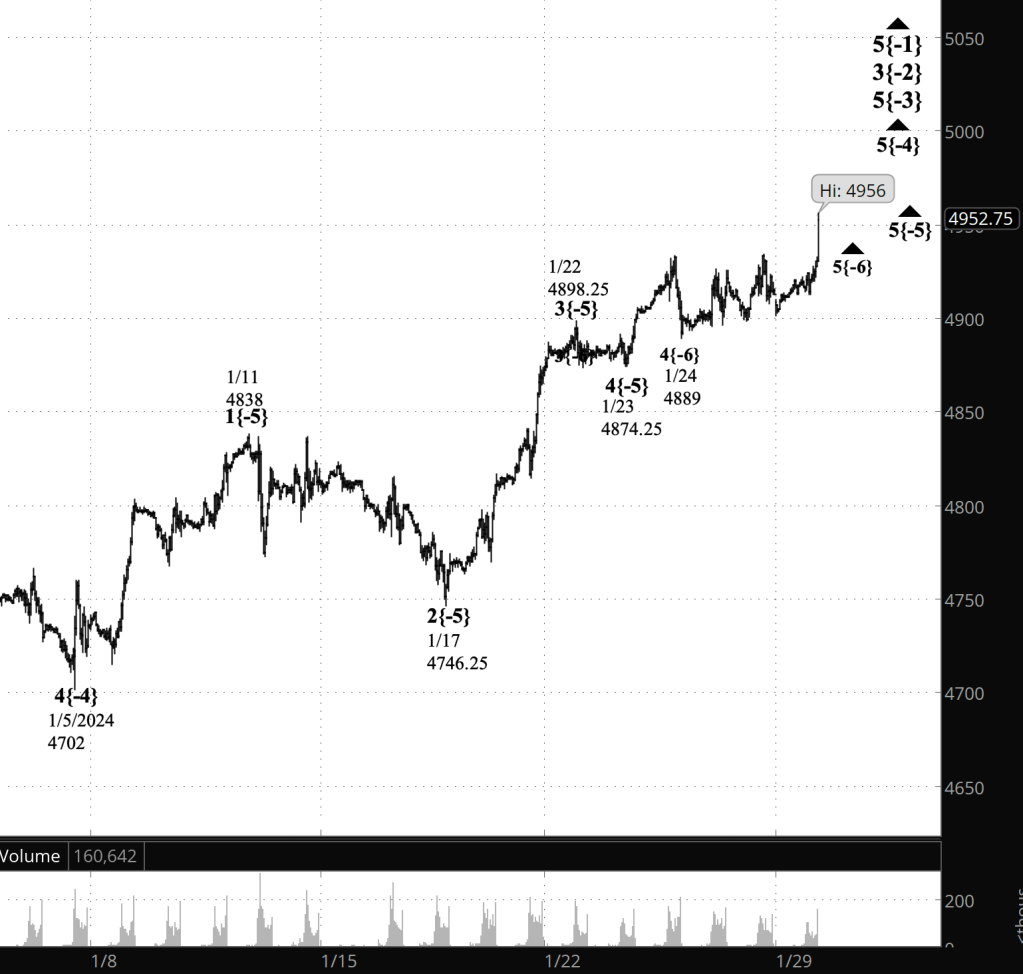
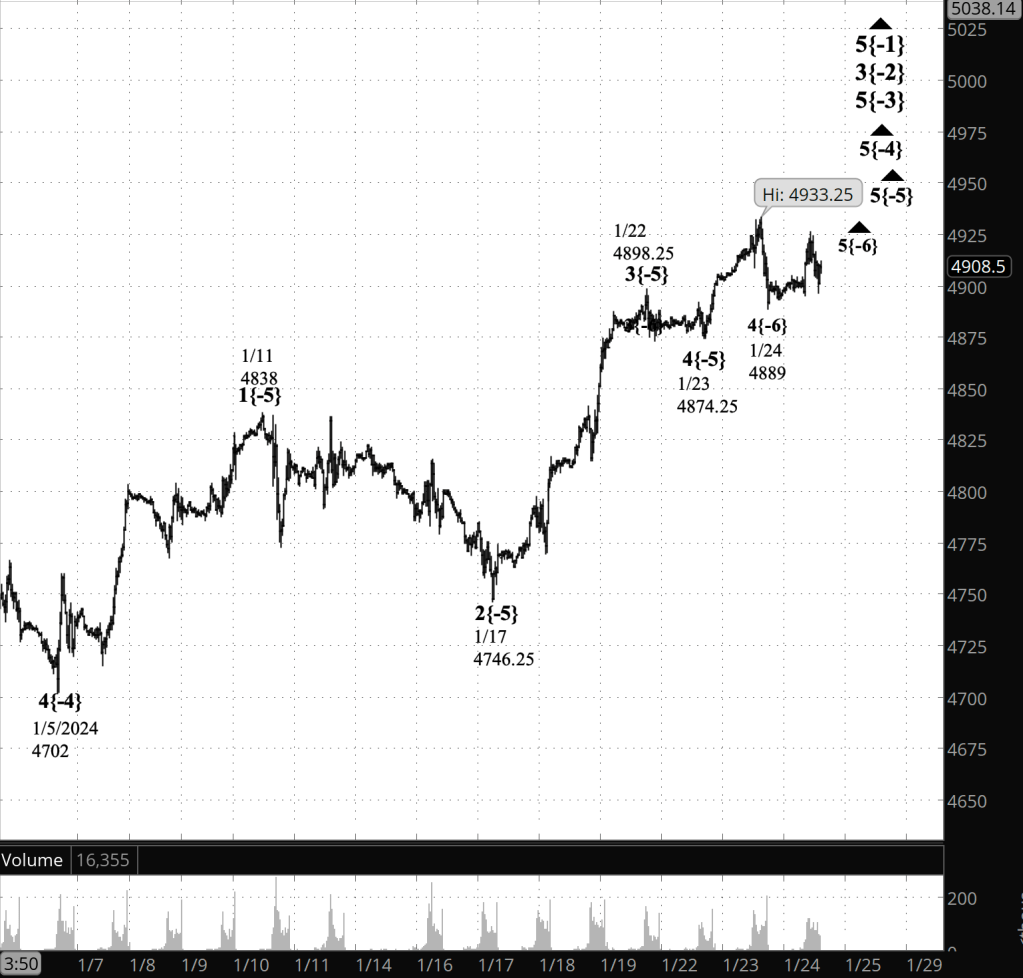
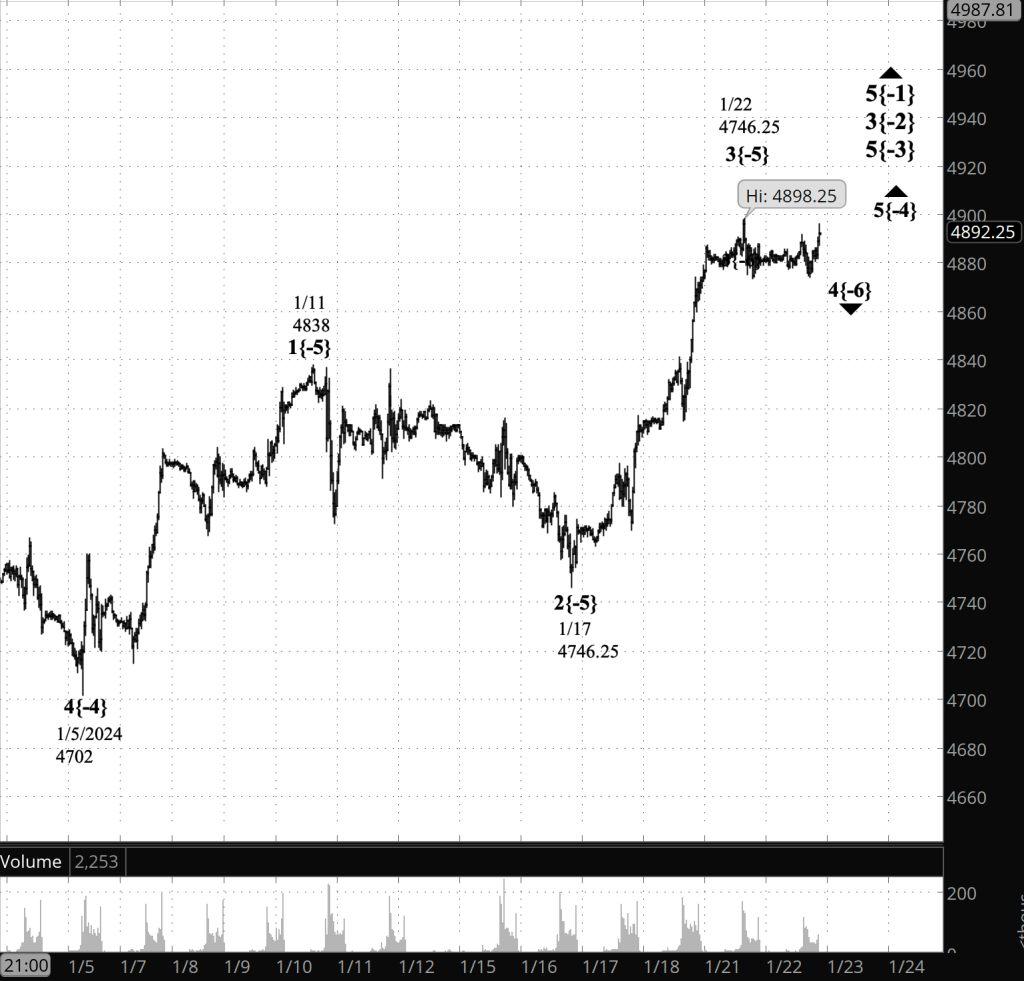
Charts. The upper chart shows the S&P 500 futures, focusing on uptrending wave 5{-3} and its internal structure, all subwaves of wave 3{-2}, which appears on the lower chart.

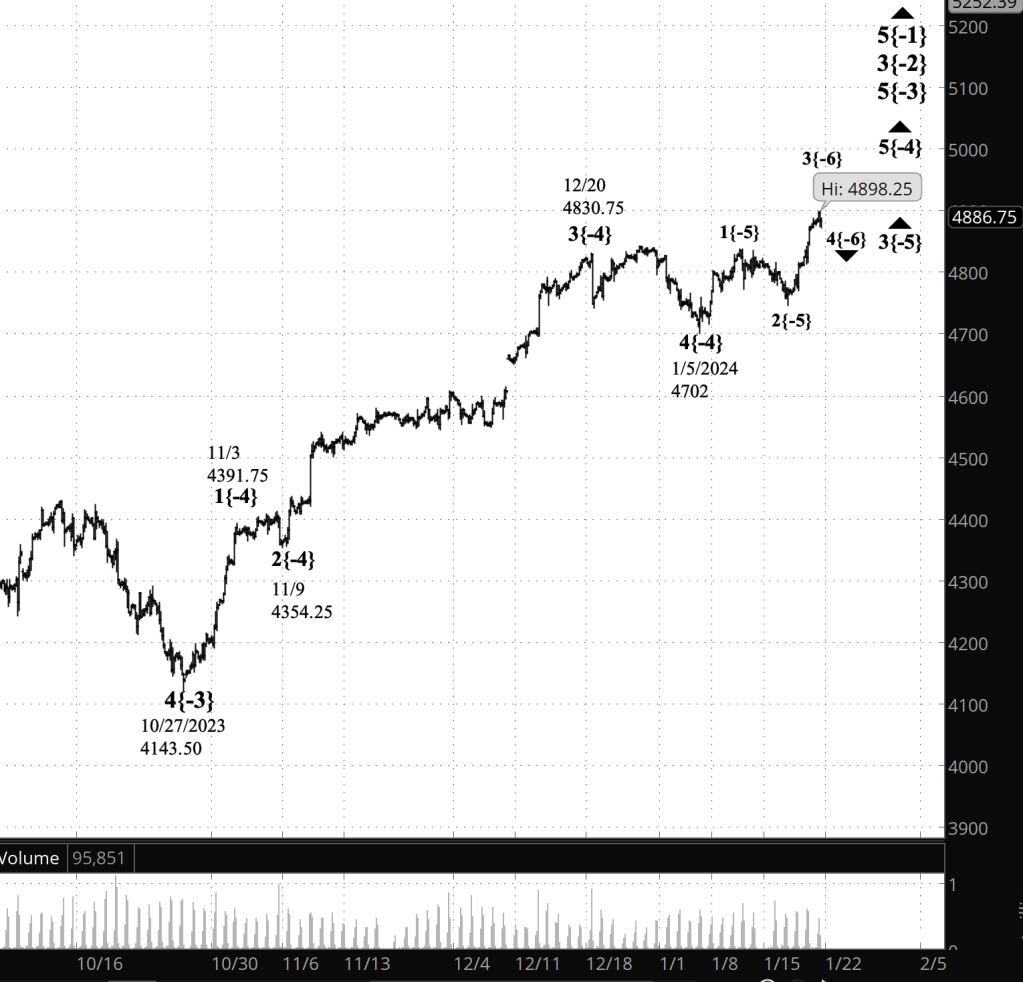
The lower chart is a big picture view of the entire expanding Diagonal Triangle that began on December 26, 2018, as traced by the S&P 500 index, showing everything down to wave 3{-2}.

[S&P 500 E-mini futures at 3:30 p.m., 3-hour bars, with volume]

[S&P 500 index at 9:34 a.m., 3-day bars]

What does Elliott wave theory say? Here are the waves that underly the analyses.

Principal Analysis:

  • Wave 5{0}, an expanding Diagonal Triangle, began on December 26, 2018.
  • Within it, an uptrend, wave 5{-1}, began on October 13, 2022 and is underway.
  • Wave 5{-1} is the parent wave of a uptrend, wave 1{-2}, that began on October 25, 2023 and is in wave 1{-3}, the first of five subwaves.
  • Wave 1{-3} is in turn in its last subwave, wave 5{-4}. When wave 5{-4} is complete, it will also be the end of wave 1{-3}, and a downward correction, wave 2{-3}, will begin.

Alternative analysis:

  • Wave 5{-3} in the principal analysis may be of a lower degree, wave 5{-4}, perhaps, or wave 5{-5}.

We Are Here.

These are the waves currently in progress under my principal analysis. Each line on the list shows the wave number, with the subscript in curly brackets, the traditional degree name, the starting date, the starting price of the S&P 500 E-mini futures, and the direction of the wave.

  • S&P 500 Index:
  • 5{+3} Supercycle, 7/8/1932, 4.40 (up)
  • 5{+2} Cycle, 12/9/1974, 60.96 (up)
  • 5{+1} Primary, 3/6/2009, 666.79 (up)
  • 5{0} Intermediate, 12/26/2018, 2346.58 (up)
  • S&P 500 Futures and index:
  • 5{-1} Minor, 10/13/2022, 3502 (up) (futures), 3491.58 (up) (index)
  • S&P 500 Futures:
  • 1{-2} Minute, 10/27/2023, 4143.50 (up)
  • 5{-3} Minuette, 10/27/2023, 4143.50 (up)

Reading the chart. Price movements — waves – – in Elliott wave analysis are labeled with numbers within trending waves and letters with corrective waves. The subscripts — numbers in curly brackets — designate the wave’s degree, which, in Elliott wave analysis, means the relative position of a wave within the larger and smaller structures that make up the chart. R.N. Elliott, who in the 1930s developed the form of analysis that bears his name, viewed the chart as a complex structure of smaller waves nested within larger waves, which in turn are nested within still larger waves. In mathematics it’s called a fractal structure, where at every scale the pattern is similar to the others.

Learning and other resources. Elliott wave analysis provides context, not prophecy. As the 20th century semanticist Alfred Korzybski put it in his book Science and Sanity (1933), “The map is not the territory … The only usefulness of a map depends on similarity of structure between the empirical world and the map.” And I would add, in the ever-changing markets, we can judge that similarity of structure only after the fact.

See the menu page Analytical Methods for a rundown on where to go for information on Elliott wave analysis.

By Tim Bovee, Portland, Oregon, January 22, 2024

Disclaimer

Tim Bovee, Private Trader tracks the analysis and trades of a private trader for his own accounts. Nothing in this blog constitutes a recommendation to buy or sell stocks, options or any other financial instrument. The only purpose of this blog is to provide education and entertainment.

No trader is ever 100 percent successful in his or her trades. Trading in the stock and option markets is risky and uncertain. Each trader must make trading decisions for his or her own account, and take responsibility for the consequences.

License
Creative Commons License

All content on Tim Bovee, Private Trader by Timothy K. Bovee is licensed under a Creative Commons Attribution-ShareAlike 4.0 International License.

Based on a work at www.timbovee.com.