3:30 p.m. New York time
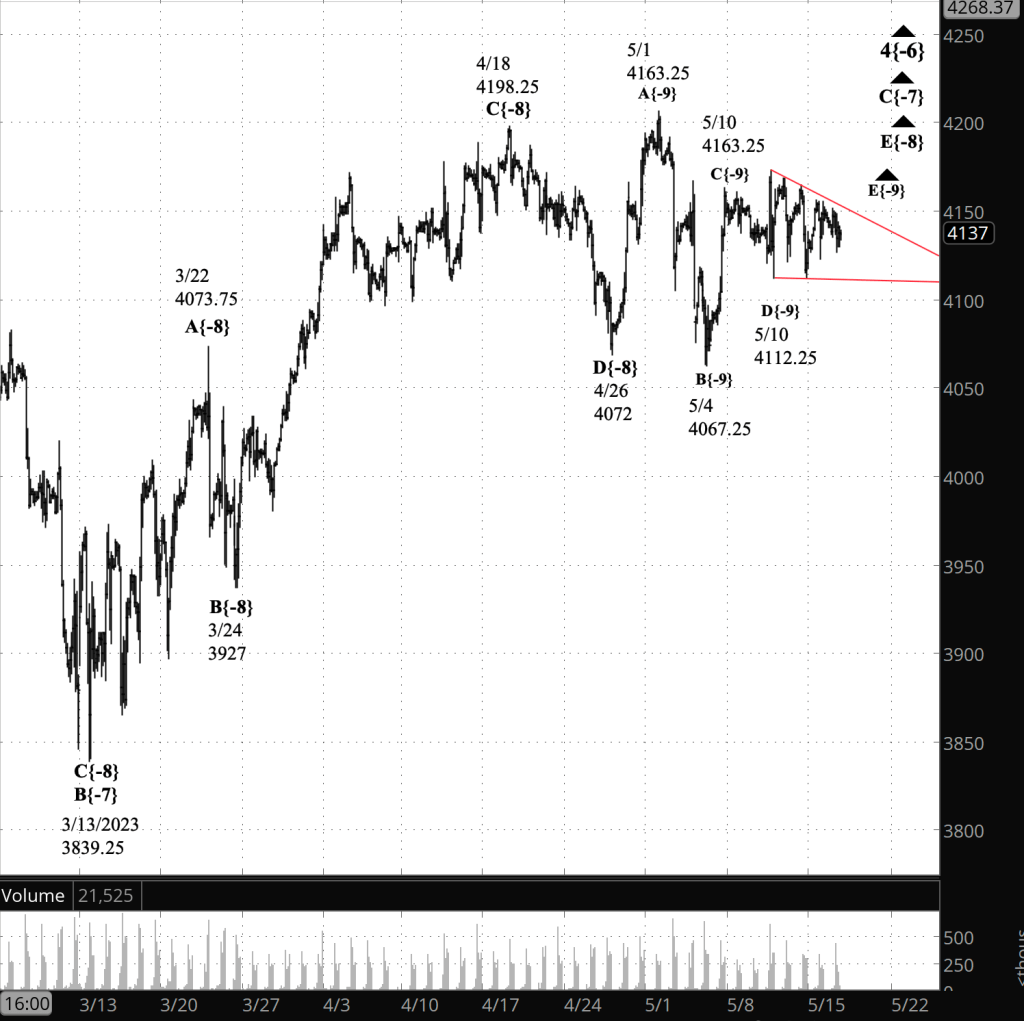
Half an hour before the closing bell. The S&P 500 futures fell during the session into the 4110s, slightly below the 68.1% Fibonacci retracement level. That’s one of the most common reversal points, in my experience. So if the price is going to reverse and keep the correction going, this is the place to do it. A confirmation would been a rise above the correction high so far, 4227.25. Conversely, if the decline keeps going, then the further it drops, the more likely it is that 4227.25 was indeed the end of the upward correction and an energetic downtrend has begun.
For now, I’m keeping the chart labeling as it was this morning, based on the scenario that the correction continues. I’ve updated the chart to show the additional decline.
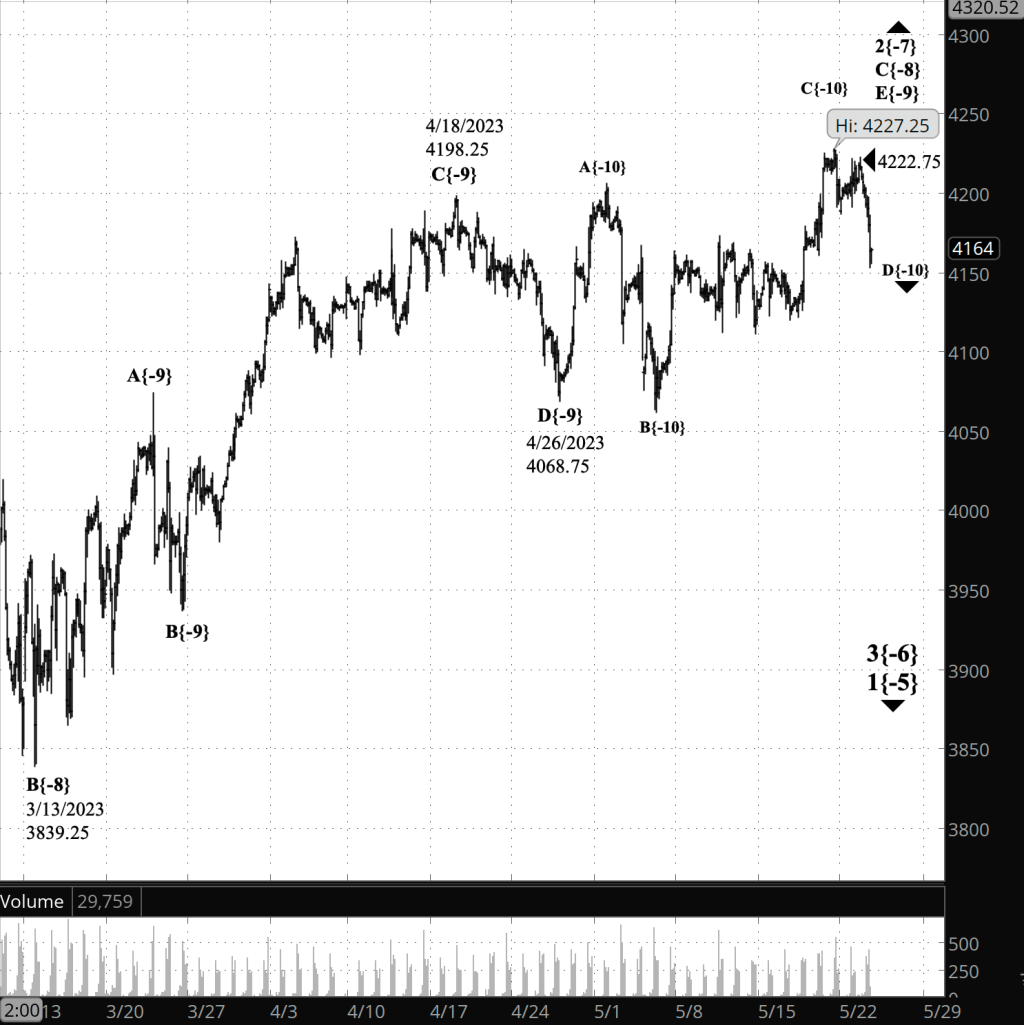
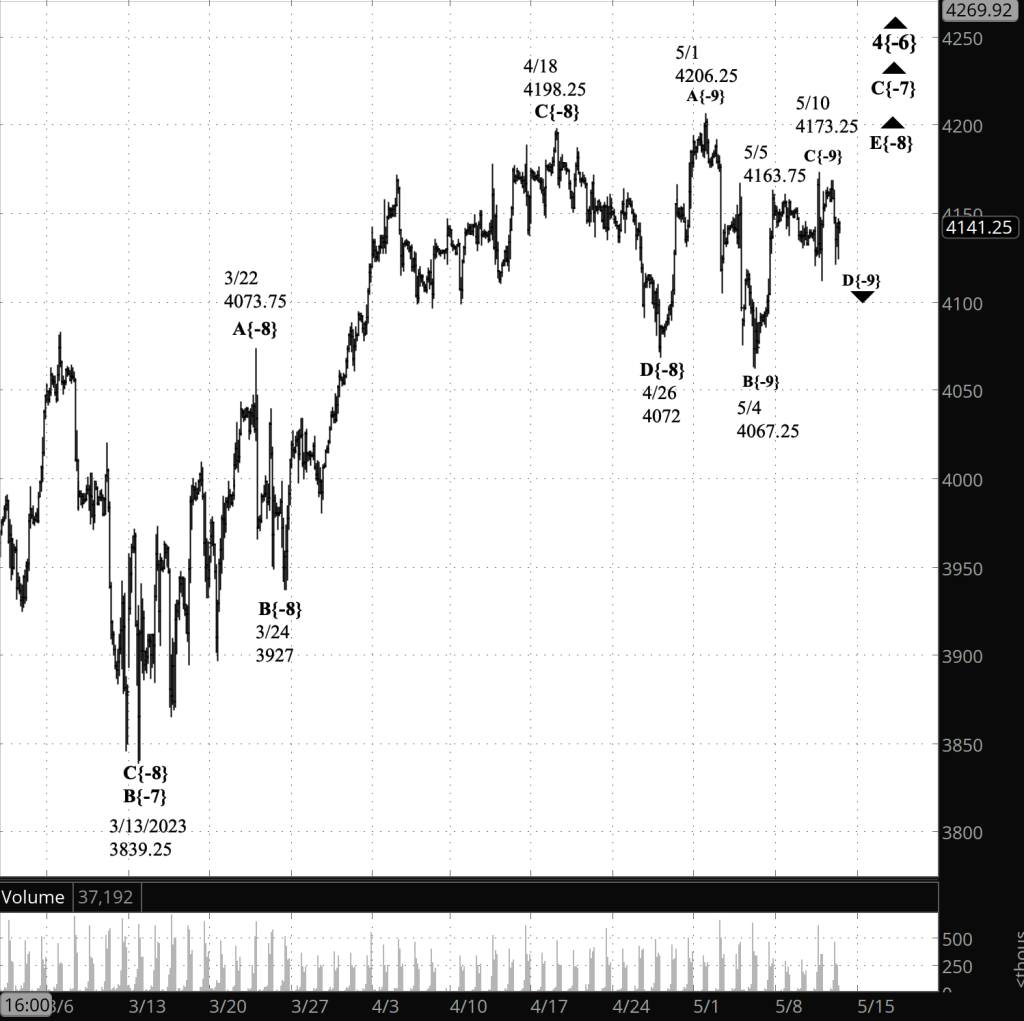
9:35 a.m. New York time
What’s happening now? The S&P 500 E-mini futures continued to fall overnight, reaching into the 4130s.
What does it mean? The downtrend can mean a couple of things, and it’s not clear which. The question: Has the correction that began on October 13, 2022 ended, or is it still underway as it moves through its final stages?
The evidence that the correction has ended: The decline has possibly formed five waves, which increases the odds that the upward correction ended on May 19 at 4227.75.
The evidence that the correction continues: Subtracting from those odds is the fact that the decline has retraced only 50% of the preceding upward movement. Moreover, the small upward movement that follows the 3rd wave within the downward movement is quite small, so it may be a subwave one degree lower than the decline and that 3rd wave might well still be underway.
For the present I’m retaining the scenario that sees the decline as a movement within the last subwave of the upward correction that began last October.
A decline below the 61.8% Fibonacci retracement level would buttress the case for the correction having ended on May 19. A fall below the end of the previous declining wave, 4062.25, would persuade me that the correction had ended and a powerful downtrend had begun.
What are the alternatives? In addition to the two possibilities discussed above, the correction may form a compound structure. The end of the present corrective pattern won’t complete the correction. Instead, it will be followed by a declining connecting wave and then a second corrective pattern. Compound corrections can be formed from as many as three corrective patterns.
Reading the chart. I’ve placed a Fibonacci retracement ladder on the chart, in red, to better judge how much of the previous rise has been retraced by the present decline.
Price movements — waves – – in Elliott wave analysis are labeled with numbers within trending waves and letters with corrective waves. The subscripts — numbers in curly brackets — designate the wave’s degree, which, in Elliott wave analysis, means the relative position of a wave within the larger and smaller structures that make up the chart. R.N. Elliott, who in the 1930s developed the form of analysis that bears his name, viewed the chart as a complex structure of smaller waves nested within larger waves, which in turn are nested within still larger waves. In mathematics it’s called a fractal structure, where at every scale the pattern is similar to the others.
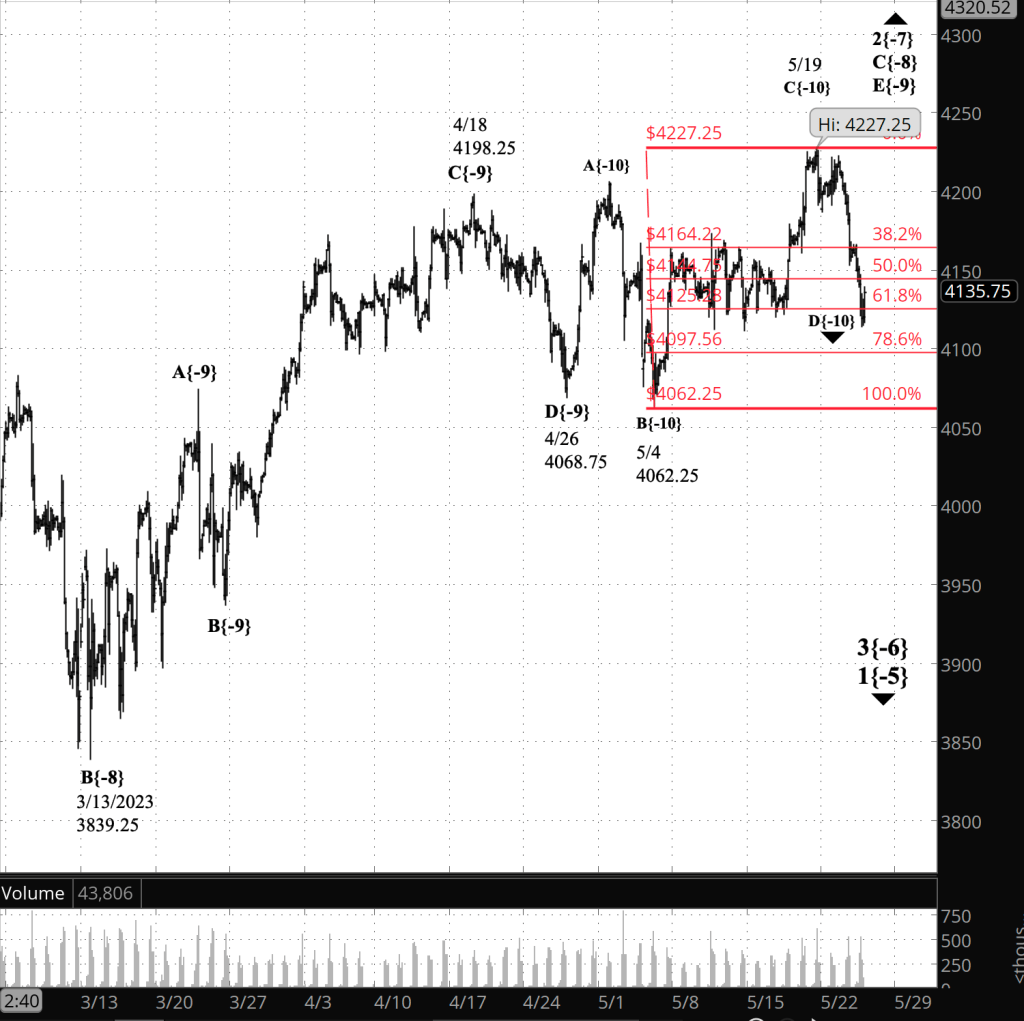
[S&P 500 E-mini futures at 3:30 p.m., 140-minute bars, with volume]
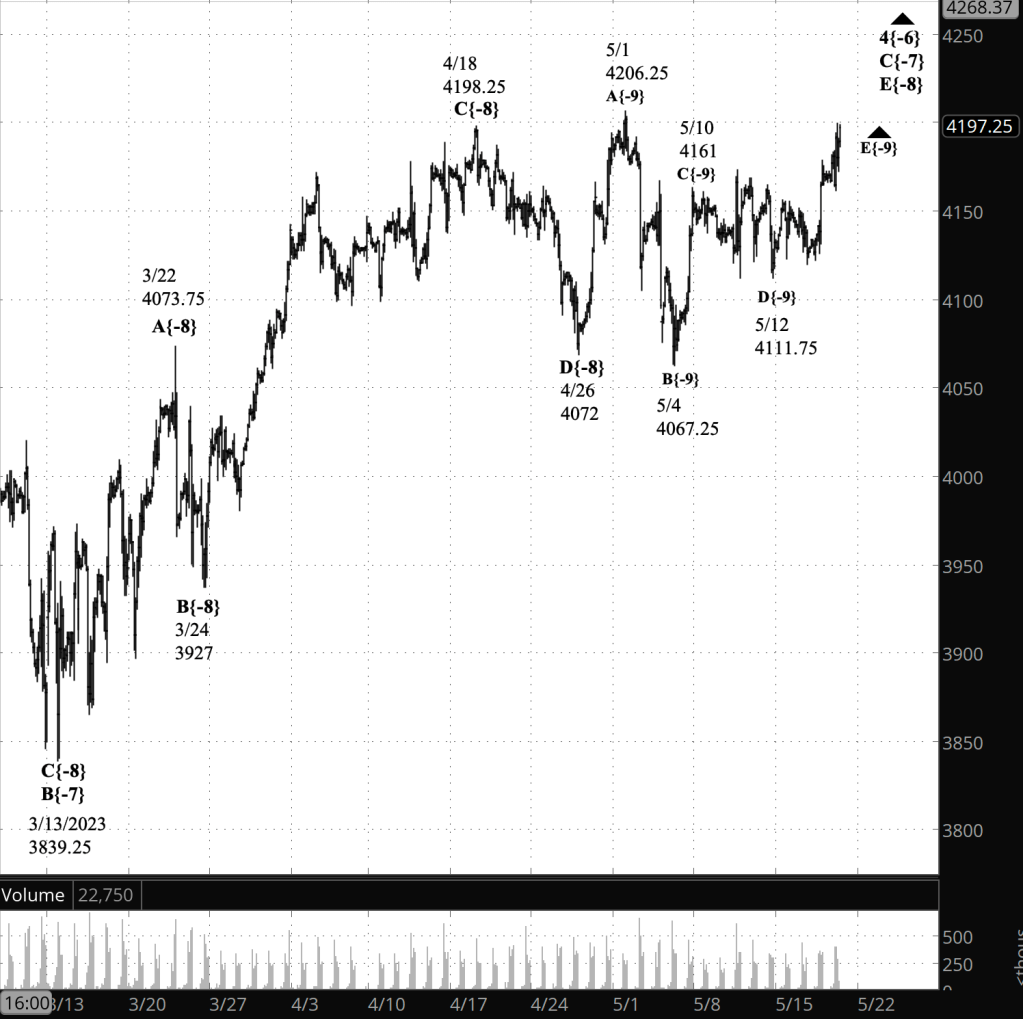
What does Elliott wave theory say? Here are the waves that underly the analyses. There are two principal analyses because we are at a moment of profound ambiguity on the chart.
Principal analysis, correction complete:
- The upward correction, wave 2{-7}, that began on October 13, 2022 ended on May 19 and the downtrend, wave 3{-7}, has begun and is in its early stages.
Principal analysis, correction continues:
- The wave 2{-7} correction’s first subwave, wave A{-8}, had five subwaves, meaning the correction is taking the form of a Zigzag
- Wave 2{-7} is in its final subwave wave, C{-8}, which began on March 13, 2023.
- Wave C{-7} is in its final subwave, wave E{-9}.
- The end of wave E{-9} will cascade up the wave degrees, marking the end of waves C{-8} and of the correction, wave 2{-7}.
- Downtrending wave 3{-7} will follow the end of the correction and will carry the price a significant distance below present levels..
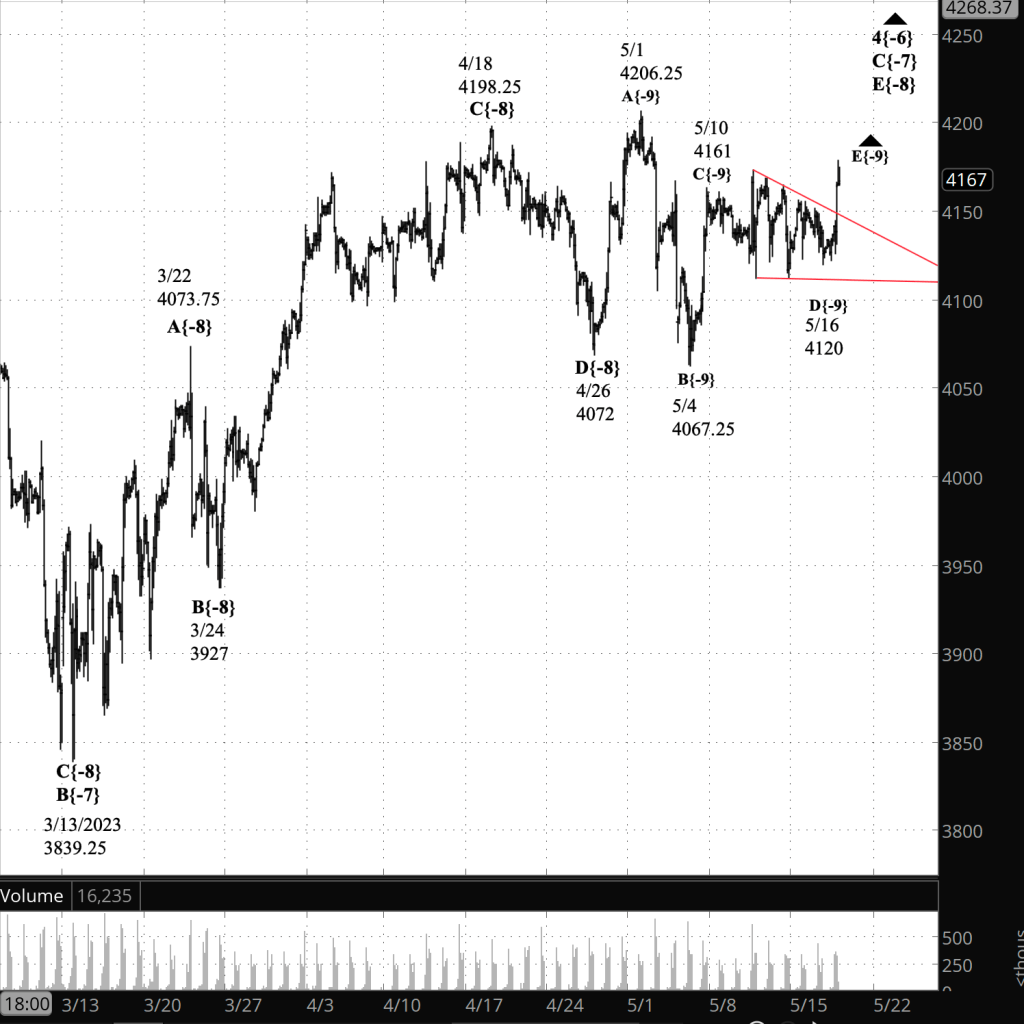
Alternative analysis, compound correction:
- The end of wave C{-8} may won’t be the end of the wave 2{-7} correction.
- Wave 2{-7} will form a compound structure and wave C{-8} ends the first corrective pattern.
- Wave C{-8} will be followed by a declining connector, wave X{-8}, and then by a second corrective pattern.
We Are Here.
These are the waves currently in progress under my principal analysis. Each line on the list shows the wave number, with the subscript in curly brackets, the traditional degree name, the starting date, the starting price of the S&P 500 E-mini futures, and the direction of the wave.
- S&P 500 Index:
- 5{+3} Supercycle, 7/8/1932, 4.40 (up)
- 5{+2} Cycle, 12/9/1974, 60.96 (up)
- 5{+1} Primary, 3/6/2009, 666.79 (up)
- 5{0} Intermediate, 12/26/2018, 2346.58 (up)
- S&P 500 Futures and index:
- 4{-1} Minor, 1/4/2022, 4808.25 (down) (futures), 4818.62 (down) (index)
- S&P 500 Futures:
- 1{-2} Minute, 1/4/2022, 4808.25 (down)
- 1{-3} Minuette, 1/4/2022, 4808.25 (down)
- 1{-4} Subminuette, 1/4/2022, 4808.25 (down)
- 1{-5} Micro, 1/4/2022, 4808.25 (down)
- 3{-6} Submicro, 8/16/2022, 4327.50 (down)
- 2{-7} Minuscule, 10/13/2022, 3577.75 (up)
Learning and other resources. Elliott wave analysis provides context, not prophecy. As the 20th century semanticist Alfred Korzybski put it in his book Science and Sanity (1933), “The map is not the territory … The only usefulness of a map depends on similarity of structure between the empirical world and the map.” And I would add, in the ever-changing markets, we can judge that similarity of structure only after the fact.
See the menu page Analytical Methods for a rundown on where to go for information on Elliott wave analysis.
By Tim Bovee, Portland, Oregon, May 24, 2023
Disclaimer
Tim Bovee, Private Trader tracks the analysis and trades of a private trader for his own accounts. Nothing in this blog constitutes a recommendation to buy or sell stocks, options or any other financial instrument. The only purpose of this blog is to provide education and entertainment.
No trader is ever 100 percent successful in his or her trades. Trading in the stock and option markets is risky and uncertain. Each trader must make trading decisions for his or her own account, and take responsibility for the consequences.
License
All content on Tim Bovee, Private Trader by Timothy K. Bovee is licensed under a Creative Commons Attribution-ShareAlike 4.0 International License.
Based on a work at www.timbovee.com.


You must be logged in to post a comment.