Trader’s Notebook

3:30 p.m. New York time

Half an hour before the closing bell. The S&P 500 futures delivered a whipsaw today, quickly rising to 4173.25 before the opening bell and declining during the session to 4112.25. It then started to rise again.

The whipsaw poses some problems for this morning’s analysis, since it carried the price above the May 5 high and then below yesterday’s low. It doesn’t break any strict rules of Elliott wave analysis, but it runs contrary to the subjective concept within the Elliott wave methodology, that a wave ought to have the right look and feel consistent with its position in the sequential progress of and the hierarchy of waves.

Whipsaws often produce terrible looks and feels. So here’s how I’ve dealt with it in my revised analysis of the low-degree waves.

Wave C{-9}, rather than ending on May 5, ended at today’s session high, 4173.25. The subsequent decline is wave D{-9}, which is still underway.

Contrary to this morning’s analysis, wave E{-9} has not yet begun.

If the price quickly rises above 4173.25, then I’ll change the analysis to show wave C{-9} as being underway.

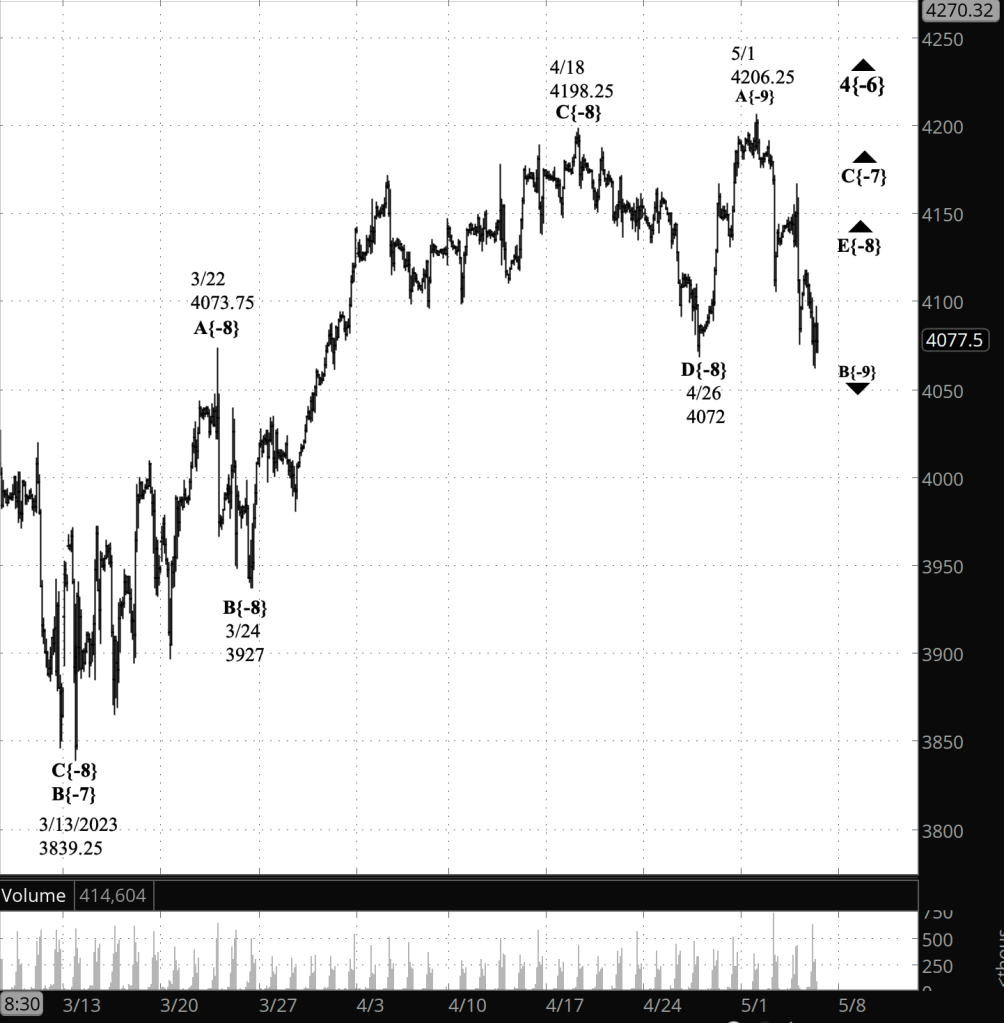
Everything else remains as it was in this morning’s analysis: The upward correction, wave 4{-6}, is still underway and is in the final waves for two degrees down, waves C{-7} and E{-8}.

I’ve kept this morning’s chart with the old analysis for comparison. Here’s the new chart, with the revised analysis.

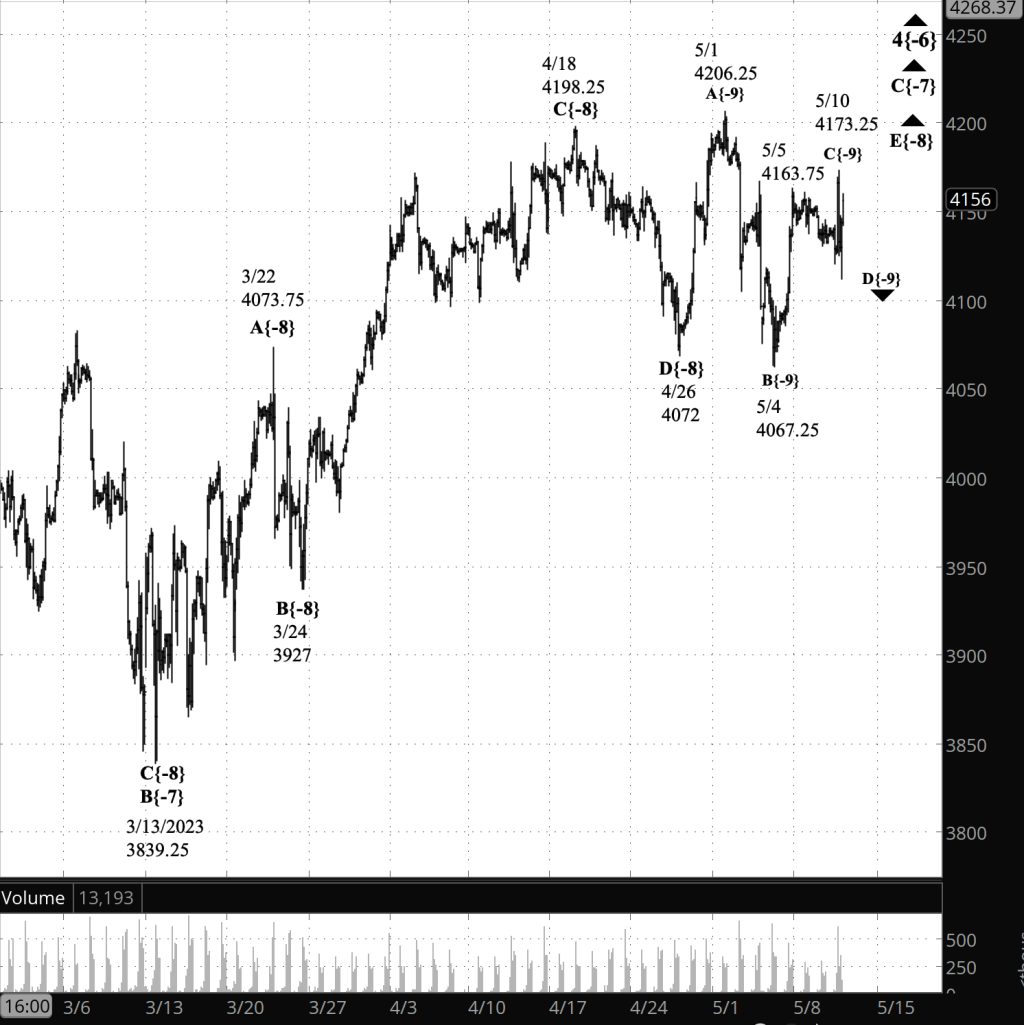
[New analysis: S&P 500 E-mini futures at 3:30 p.m., 120-minute bars, with volume]

9:35 a.m. New York time

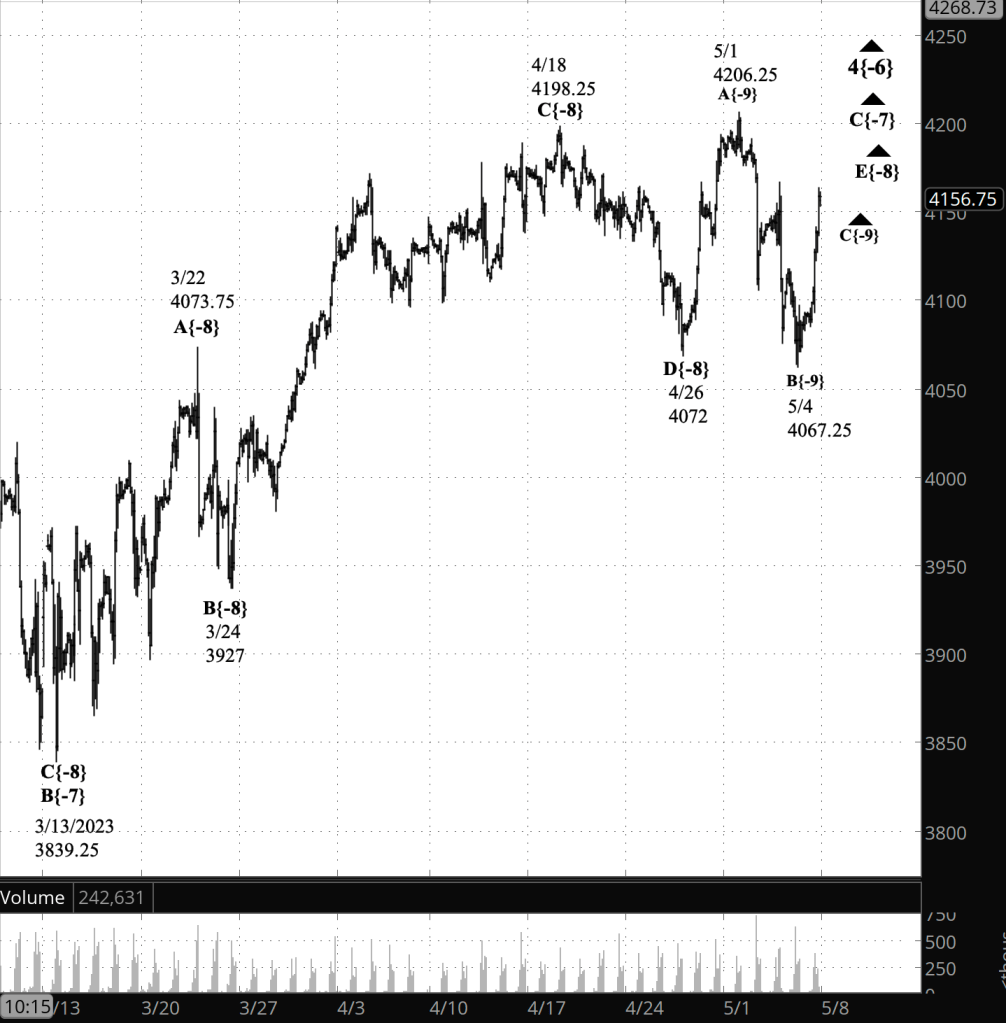
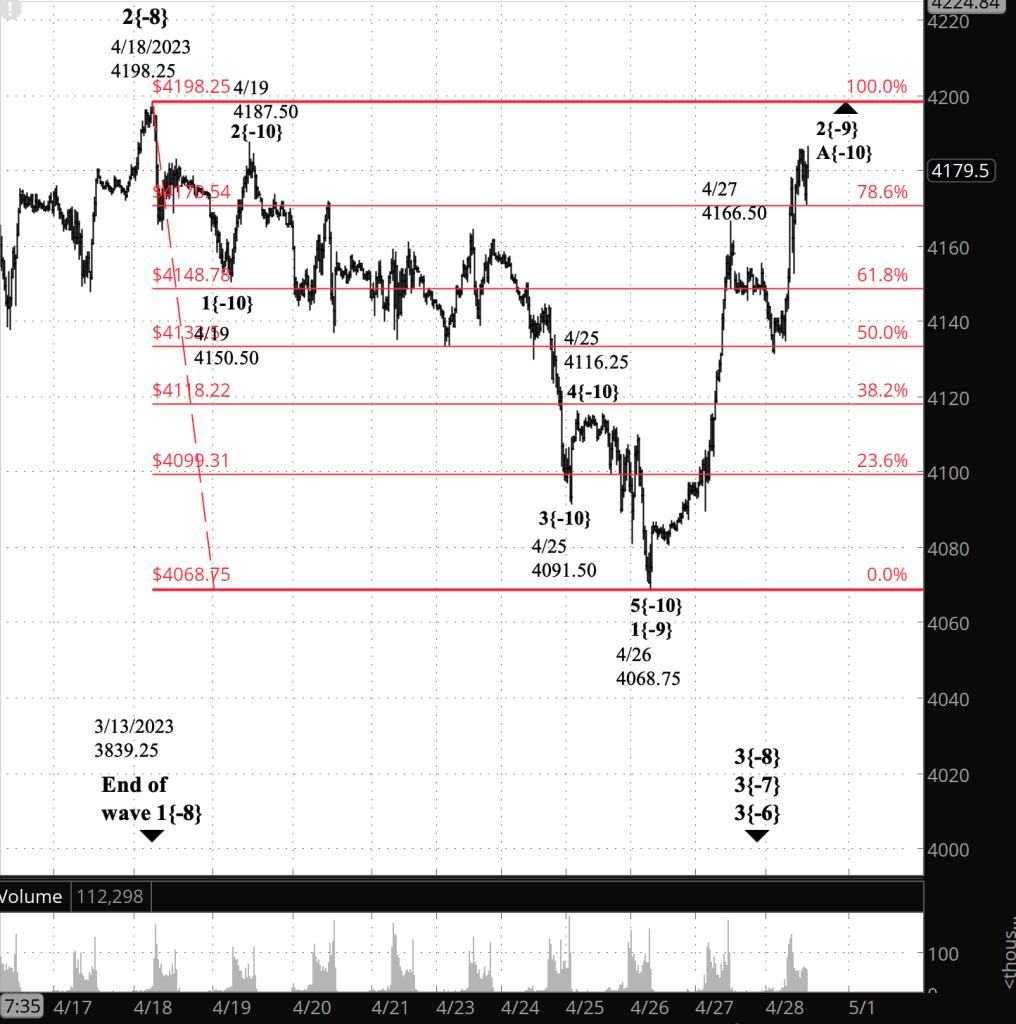
What’s happening now? The S&P 500 E-mini futures fell to a low overnight of 4120.50 but rose immediately 4152.75 when fresh inflation stats confirmed analysts’ forecasts. The price continued to work its way higher, reaching into the 4170s

What does it mean? The upward correction continues and is in the last subwave of the last leg of its journey. This morning’s peak exceeded the May 5 high, 4163.75, which I analyzed yesterday as being the end of the middle segment of that last subwave. The higher high has several possible interpretations. My principal analysis has the decline to the overnight low as being the 4th segment within the last subwave, and the last segment as being underway.

The end of that last segment, wave E{-9} on the chart, will also be the end of the last segment, E{-8}, within the last leg, C{-7}, of the upward correction, wave 4{-6}. When the correction is complete, a downtrend will follow, carrying the price below the correction’s starting point, 3502, and possibly well below that level.

What are the alternatives? If the correction forms a compound structure, then the present corrective pattern won’t complete the correction. Instead, it will be followed by a declining wave and then a second corrective pattern. Compound corrections can be formed from as many as three patterns.

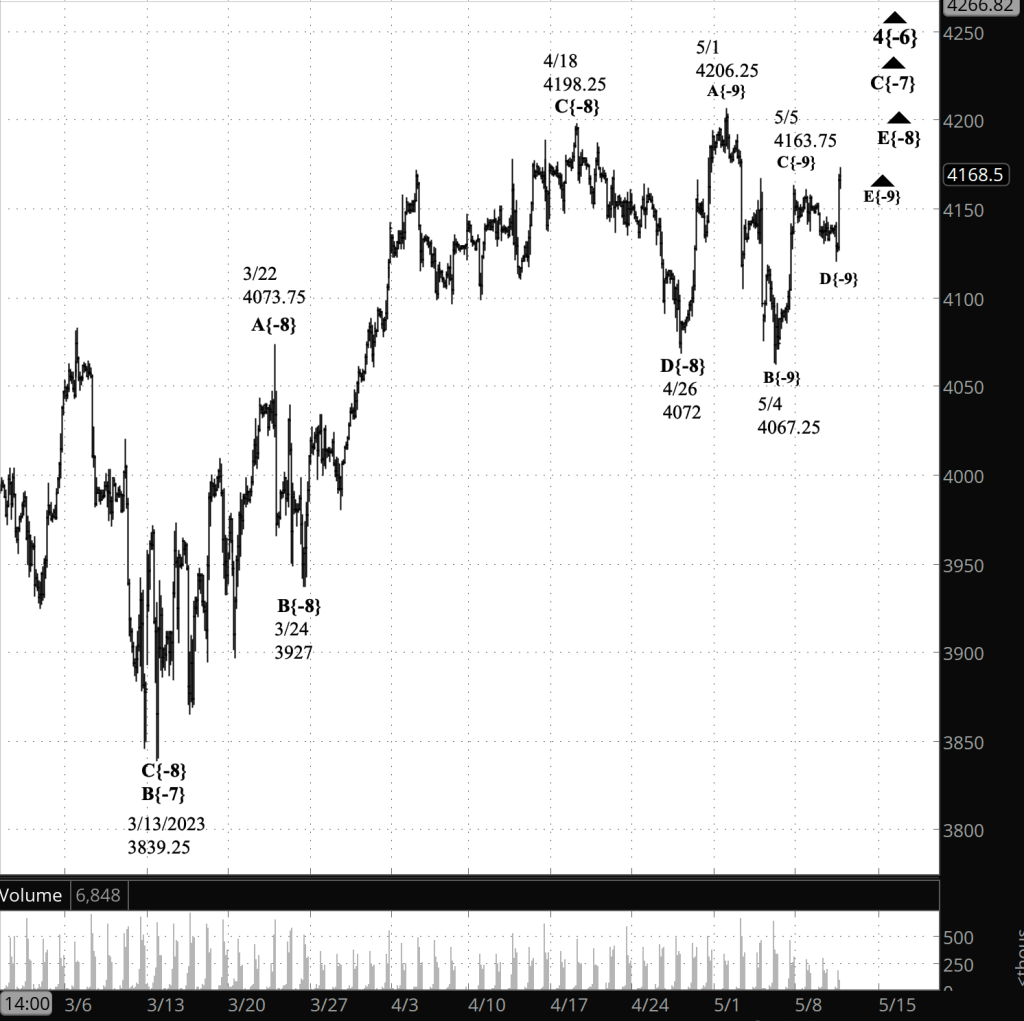
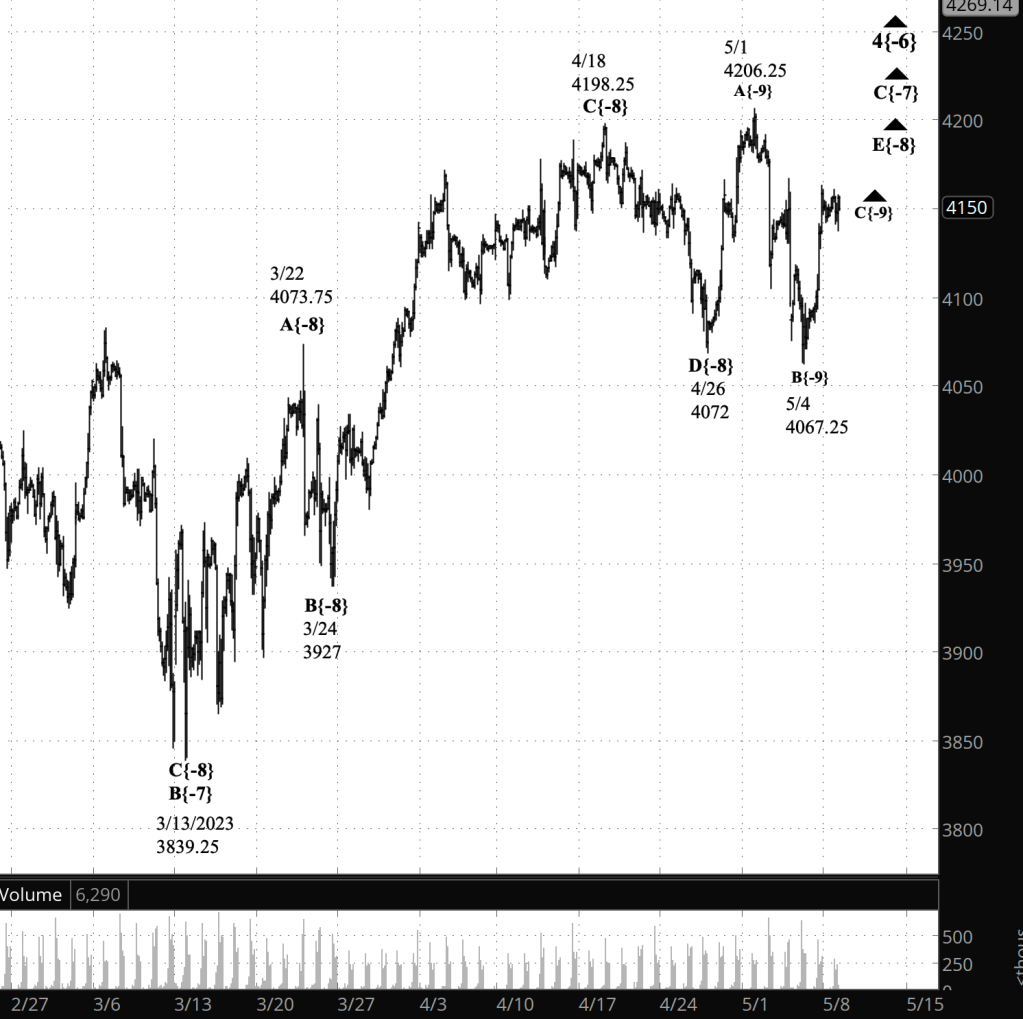
[Now outdated: S&P 500 E-mini futures at 9:35 a.m., 120-minute bars, with volume]

What does Elliott wave theory say? Here are the waves that underly this afternoon’s revised analyses (see upper chart).

Principal analysis:

  • An upward correction, wave 4{-6}, began on October 13, 2022 and is underway.
  • The correction’s first subwave, wave A{-7}, had five subwaves, meaning the correction is taking the form of a Zigzag
  • Wave 4{-6} is in its final subwave wave, C{-7}, which began on March 13, 2023.
  • Wave C{-7} is in its final subwave, wave E{-8}.
  • Wave E{-8} is in its next-to-the-last subwave, falling wave D{-9}.
  • Wave 4{-6} will be followed by downtrending wave 5{-6}, which, like all 5th waves, might match one of a number of different patterns, all based on the downtrend’s relation with the end of the preceding 3rd wave, at 3502.
  • Almost always a 5th wave will move past the preceding 3rd wave’s end point.
  • Some 5th waves are truncated, and on this chart that means wave 5{-6} would end before reaching 3502.
  • Some 5th waves are extended, that would mean wave 5{-6} would have nine waves internally rather than the usual five, and would cover a greater than expected distance over a greater than expected period of time.

Alternative analysis:

  • The end of wave C{-7} may won’t be the end of the wave 4{-6} correction.
  • Wave 4{-6} will form a compound structure and wave C{-7} ends the first corrective pattern.
  • Wave C{-7} will be followed by a declining connector, wave X{-7}, and then by a second corrective pattern.

Bigger structures:

  • This is all happening within downtrending wave 1{-5}, which began on January 4, 2022 from 4808.25.
  • Wave 1{-5} is a subwave of a nested series of larger subwaves, from wave 1{-4} to wave 1{-2}. which also began on January 4, 2022.
  • Wave 1{-2} is a subwave of wave 4{-1}, the next-to-the-last wave within a large expanding Diagonal Triangle, wave 5{0}, that began on December 26, 2018.
  • When wave 4{-1} is complete, wave 5{-1} will begin and will carry the wave above the January 4 high.25, and back to the upper boundary of the triangle, which gets higher continually and is in the 6140s.

Reading the chart. Elliott wave analysis views the chart as a complex structure of smaller waves nested within larger waves, which in turn are nested within still larger waves. My labeling system assigns numbers to the subwaves of trending waves, and letters to the subwaves of corrections. Each number or letter is followed by a subscript, in curly brackets, showing the waves position within the complex structure, called its “degree” in Elliott wave parlance. The smaller the number, the lower the degree. On this chart we’re dealing with relatively small waves, so the degree numbers are negative.

We Are Here.

These are the waves currently in progress under my principal analysis. Each line on the list shows the wave number, with the subscript in curly brackets, the traditional degree name, the starting date, the starting price of the S&P 500 E-mini futures, and the direction of the wave.

  • S&P 500 Index:
  • 5{+3} Supercycle, 7/8/1932, 4.40 (up)
  • 5{+2} Cycle, 12/9/1974, 60.96 (up)
  • 5{+1} Primary, 3/6/2009, 666.79 (up)
  • 5{0} Intermediate, 12/26/2018, 2346.58 (up)
  • S&P 500 Futures and index:
  • 4{-1} Minor, 1/4/2022, 4808.25 (down) (futures), 4818.62 (down) (index)
  • S&P 500 Futures:
  • 1{-2} Minute, 1/4/2022, 4808.25 (down)
  • 1{-3} Minuette, 1/4/2022, 4808.25 (down)
  • 1{-4} Subminuette, 1/4/2022, 4808.25 (down)
  • 1{-5} Micro, 1/4/2022, 4808.25 (down)
  • 4{-6} Submicro, 10/13/2022, 3502 (up)
  • C{-7} Minuscule, 3/13/2023, 3830.25 (up)

Learning and other resources. Elliott wave analysis provides context, not prophecy. As the 20th century semanticist Alfred Korzybski put it in his book Science and Sanity (1933), “The map is not the territory … The only usefulness of a map depends on similarity of structure between the empirical world and the map.” And I would add, in the ever-changing markets, we can judge that similarity of structure only after the fact.

See the menu page Analytical Methods for a rundown on where to go for information on Elliott wave analysis.

By Tim Bovee, Portland, Oregon, May 10, 2023

Disclaimer

Tim Bovee, Private Trader tracks the analysis and trades of a private trader for his own accounts. Nothing in this blog constitutes a recommendation to buy or sell stocks, options or any other financial instrument. The only purpose of this blog is to provide education and entertainment.

No trader is ever 100 percent successful in his or her trades. Trading in the stock and option markets is risky and uncertain. Each trader must make trading decisions for his or her own account, and take responsibility for the consequences.

License
Creative Commons License

All content on Tim Bovee, Private Trader by Timothy K. Bovee is licensed under a Creative Commons Attribution-ShareAlike 4.0 International License.

Based on a work at www.timbovee.com.

Trader’s Notebook

3:30 p.m. New York time

Half an hour before the closing bell. The S&P 500 futures traded narrowly during the session, as the upward correction, wave 4[-6}, continues. Wave 4{-6} is in its third and final wave, C{-7}, which is in its final subwave, wave E{-8}, which is in its next-to-the-last subwave, downward wave D{-9}.

The beginning of wave D{-9} is new development since this morning’s analysis. All else is unchanged. I’ve updated the chart and the Elliott wave theory section.

9:35 a.m. New York time

What’s happening now? The S&P 500 E-mini futures fell overnight from the 4150s to the 4130s, continuing a sideways movement that has been underway since last week.

What does it mean? The upward correction that began 17 months ago continues and is nearing its end. It will be followed by a downtrend that will carry the price significantly lower.

What are the alternatives? Or at least, probably is nearing its end. If the correction forms a compound structure, then the present corrective pattern will be followed by a declining wave and then a second corrective pattern. Compound corrections can be formed from as many as three patterns.

[S&P 500 E-mini futures at 3:30 p.m., 2-hour bars, with volume]

What does Elliott wave theory say? Here are the waves that underly the analyses.

Principal analysis:

  • An upward correction, wave 4{-6}, began on October 13, 2022 and is underway.
  • The correction’s first subwave, wave A{-7}, had five subwaves, meaning the correction is taking the form of a Zigzag
  • Wave 4{-6} is in its final subwave wave, C{-7}, which began on March 13, 2023.
  • Wave C{-7} is in its final subwave, wave E{-8}.
  • Wave E{-8} is in its fourth subwave, falling wave D{-9}.
  • Wave E{-8} will have five subwaves altogether once it is complete.
  • Wave 4{-6} will be followed by downtrending wave 5{-6}, which, like all 5th waves, might match one of a number of different patterns, all based on the downtrend’s relation with the end of the preceding 3rd wave, at 3502.
  • Almost always a 5th wave will move past the preceding 3rd wave’s end point.
  • Some 5th waves are truncated, and on this chart that means wave 5{-6} would end before reaching 3502.
  • Some 5th waves are extended, that would mean wave 5{-6} would have nine waves internally rather than the usual five, and would cover a greater than expected distance over a greater than expected period of time.

Alternative analysis:

  • Wave C{-7} may have ended on May 1 but that is not the end of the wave 4{-6} correction.
  • Wave 4{-6} is forming a compound structure and wave C{-7} ends the first corrective pattern.
  • Wave C{-7} will be followed by a declining connector, wave X{-7}, and then by a second corrective pattern.

Bigger structures:

  • This is all happening within downtrending wave 1{-5}, which began on January 4, 2022 from 4808.25.
  • Wave 1{-5} is a subwave of a nested series of larger subwaves, from wave 1{-4} to wave 1{-2}. which also began on January 4, 2022.
  • Wave 1{-2} is a subwave of wave 4{-1}, the next-to-the-last wave within a large expanding Diagonal Triangle, wave 5{0}, that began on December 26, 2018.
  • When wave 4{-1} is complete, wave 5{-1} will begin and will carry the wave above the January 4 high.25, and back to the upper boundary of the triangle, which gets higher continually and is in the 6140s.

Reading the chart. Elliott wave analysis views the chart as a complex structure of smaller waves nested within larger waves, which in turn are nested within still larger waves. My labeling system assigns numbers to the subwaves of trending waves, and letters to the subwaves of corrections. Each number or letter is followed by a subscript, in curly brackets, showing the waves position within the complex structure, called its “degree” in Elliott wave parlance. The smaller the number, the lower the degree. On this chart we’re dealing with relatively small waves, so the degree numbers are negative.

We Are Here.

These are the waves currently in progress under my principal analysis. Each line on the list shows the wave number, with the subscript in curly brackets, the traditional degree name, the starting date, the starting price of the S&P 500 E-mini futures, and the direction of the wave.

  • S&P 500 Index:
  • 5{+3} Supercycle, 7/8/1932, 4.40 (up)
  • 5{+2} Cycle, 12/9/1974, 60.96 (up)
  • 5{+1} Primary, 3/6/2009, 666.79 (up)
  • 5{0} Intermediate, 12/26/2018, 2346.58 (up)
  • S&P 500 Futures and index:
  • 4{-1} Minor, 1/4/2022, 4808.25 (down) (futures), 4818.62 (down) (index)
  • S&P 500 Futures:
  • 1{-2} Minute, 1/4/2022, 4808.25 (down)
  • 1{-3} Minuette, 1/4/2022, 4808.25 (down)
  • 1{-4} Subminuette, 1/4/2022, 4808.25 (down)
  • 1{-5} Micro, 1/4/2022, 4808.25 (down)
  • 4{-6} Submicro, 10/13/2022, 3502 (up)
  • C{-7} Minuscule, 3/13/2023, 3830.25 (up)

Learning and other resources. Elliott wave analysis provides context, not prophecy. As the 20th century semanticist Alfred Korzybski put it in his book Science and Sanity (1933), “The map is not the territory … The only usefulness of a map depends on similarity of structure between the empirical world and the map.” And I would add, in the ever-changing markets, we can judge that similarity of structure only after the fact.

See the menu page Analytical Methods for a rundown on where to go for information on Elliott wave analysis.

By Tim Bovee, Portland, Oregon, May 9, 2023

Disclaimer

Tim Bovee, Private Trader tracks the analysis and trades of a private trader for his own accounts. Nothing in this blog constitutes a recommendation to buy or sell stocks, options or any other financial instrument. The only purpose of this blog is to provide education and entertainment.

No trader is ever 100 percent successful in his or her trades. Trading in the stock and option markets is risky and uncertain. Each trader must make trading decisions for his or her own account, and take responsibility for the consequences.

License
Creative Commons License

All content on Tim Bovee, Private Trader by Timothy K. Bovee is licensed under a Creative Commons Attribution-ShareAlike 4.0 International License.

Based on a work at www.timbovee.com.

Trader’s Notebook

3:30 p.m. New York time

Half an hour before the closing bell. The S&P 500 futures fell to 4137.50 and then rose past the decline’s starting point, into the 4150s. The upward correction continues. No change from this morning’s analysis. I’ve updated the chart.

9:35 a.m. New York time

What’s happening now? The S&P 500 E-mini futures initially fell when trading resumed overnight, then rose, covering a range of slightly less than 20 points, and the fell back slightly.

What does it mean? The upward correction that began last year on October 13, a 4th wave, continues and is working through its final subwave. When the correction is complete, it will be followed by a 5th-wave downtrend that will carry the price well below the start of the correction from 3839.25. When the five subwaves within that downtrend are complete, it will also be the completion of the parent wave, a downtrending 1st wave that began on January 4, 2022 from 4808.25, the starting point of the bear market that has dominated investing and trading for the past 17 months.

What are the alternatives? There is one. The upward correction is forming a compound structure, linking two or three corrective patterns together. The present “last leg” of the correction, under the principal analysis, won’t be the end of the analysis under this alternative but only the end of the first corrective pattern. The first pattern will be followed by a declining connector wave and then a second corrective pattern.

[S&P 500 E-mini futures at 3:30 p.m., 2-hour bars, with volume]

What does Elliott wave theory say? Here are the waves that underly the analyses.

Principal analysis:

  • An upward correction, wave 4{-6}, began on October 13, 2022 and is underway.
  • The correction’s first subwave, wave A{-7}, had five subwaves, meaning the correction is taking the form of a Zigzag
  • Wave 4{-6} is in its final subwave wave, C{-7}, which began on March 13, 2023.
  • Wave C{-7} is in its final subwave, wave E{-8}.
  • Wave E{-8} is in its third subwave, rising wave C{-9}.
  • Wave E{-8} will have five subwaves altogether once it is complete.
  • As a 4th wave, wave 4{-6} has no upper limits under Elliott wave theory.
  • Wave 4{-6} will be followed by downtrending wave 5{-6}, which, like all 5th waves, might match one of a number of different patterns, all based on the downtrend’s relation with the end of the preceding 3rd wave, at 3502.
  • Almost always a 5th wave will move past the preceding 3rd wave’s end point.
  • Some 5th waves are truncated, and on this chart that means wave 5{-6} would end before reaching 3502.
  • Some 5th waves are extended, that would mean wave 5{-6} would have nine waves internally rather than the usual five, and would cover a greater than expected distance over a greater than expected period of time.

Alternative analysis:

  • Wave C{-7} may have ended on May 1 but that is not the end of the wave 4{-6} correction.
  • Wave 4{-6} is forming a compound structure and wave C{-7} ends the first corrective pattern.
  • Wave C{-7} will be followed by a declining connector, wave X{-7}, and then by a second corrective pattern.

Bigger structures:

  • This is all happening within downtrending wave 1{-5}, which began on January 4, 2022 from 4808.25.
  • Wave 1{-5} is a subwave of a nested series of larger subwaves, from wave 1{-4} to wave 1{-2}. which also began on January 4, 2022.
  • Wave 1{-2} is a subwave of wave 4{-1}, the next-to-the-last wave within a large expanding Diagonal Triangle, wave 5{0}, that began on December 26, 2018.
  • When wave 4{-1} is complete, wave 5{-1} will begin and will carry the wave above the January 4 high.25, and back to the upper boundary of the triangle, which gets higher continually and is in the 6140s.

Reading the chart. Elliott wave analysis views the chart as a complex structure of smaller waves nested within larger waves, which in turn are nested within still larger waves. My labeling system assigns numbers to the subwaves of trending waves, and letters to the subwaves of corrections. Each number or letter is followed by a subscript, in curly brackets, showing the waves position within the complex structure, called its “degree” in Elliott wave parlance. The smaller the number, the lower the degree. On this chart we’re dealing with relatively small waves, so the degree numbers are negative.

We Are Here.

These are the waves currently in progress under my principal analysis. Each line on the list shows the wave number, with the subscript in curly brackets, the traditional degree name, the starting date, the starting price of the S&P 500 E-mini futures, and the direction of the wave.

  • S&P 500 Index:
  • 5{+3} Supercycle, 7/8/1932, 4.40 (up)
  • 5{+2} Cycle, 12/9/1974, 60.96 (up)
  • 5{+1} Primary, 3/6/2009, 666.79 (up)
  • 5{0} Intermediate, 12/26/2018, 2346.58 (up)
  • S&P 500 Futures and index:
  • 4{-1} Minor, 1/4/2022, 4808.25 (down) (futures), 4818.62 (down) (index)
  • S&P 500 Futures:
  • 1{-2} Minute, 1/4/2022, 4808.25 (down)
  • 1{-3} Minuette, 1/4/2022, 4808.25 (down)
  • 1{-4} Subminuette, 1/4/2022, 4808.25 (down)
  • 1{-5} Micro, 1/4/2022, 4808.25 (down)
  • 4{-6} Submicro, 10/13/2022, 3502 (up)
  • C{-7} Minuscule, 3/13/2023, 3830.25 (up)

Learning and other resources. Elliott wave analysis provides context, not prophecy. As the 20th century semanticist Alfred Korzybski put it in his book Science and Sanity (1933), “The map is not the territory … The only usefulness of a map depends on similarity of structure between the empirical world and the map.” And I would add, in the ever-changing markets, we can judge that similarity of structure only after the fact.

See the menu page Analytical Methods for a rundown on where to go for information on Elliott wave analysis.

By Tim Bovee, Portland, Oregon, May 8, 2023

Disclaimer

Tim Bovee, Private Trader tracks the analysis and trades of a private trader for his own accounts. Nothing in this blog constitutes a recommendation to buy or sell stocks, options or any other financial instrument. The only purpose of this blog is to provide education and entertainment.

No trader is ever 100 percent successful in his or her trades. Trading in the stock and option markets is risky and uncertain. Each trader must make trading decisions for his or her own account, and take responsibility for the consequences.

License
Creative Commons License

All content on Tim Bovee, Private Trader by Timothy K. Bovee is licensed under a Creative Commons Attribution-ShareAlike 4.0 International License.

Based on a work at www.timbovee.com.

Trader’s Notebook

3:30 p.m. New York time

Half an hour before the closing bell. The S&P 500 futures have moved a step closer to the end of the upward correction that has dominated the markets since last October.

To locate the We-Are-Here marker, we must drill down three levels from the correction wave, 4{-6}. Wave 4{-6} is a Zigzag with three waves internally, and it is in wave C{-7}, the 3rd wave. Wave C{-7}, in turn, will have five waves internally and is in the 5th wave, E{-8}. That 5th wave will also have five internal waves. It became clear today, as the price rose into the 4160s, that the 3rd of those waves, C{-9}, began yesterday from 4067.25.

Wave C{-9} typically would rise higher than wave A{-9}, which ended on May 1 at 4206.25. Looking forward, decling wave D{-9} will follow, and will in turn be followed by the final upward push: wave E{-9} within E{-8} within wave C{-7} within the upward correction, wave 4{-6}. The end of wave E{-9} will be the end of the correction.

The downtrend, wave 5{-6}, will follow and, if typical, will carry the price below the start of the correction, from 3502. Fifth waves are quirky beasts, and the price could move significantly below 3502, or it could come up short. After wave 5{-6} is complete, an even larger upward correction, wave 2{-5}, will begin.

I’ve updated the chart.

9:35 a.m. New York time

What’s happening now? The S&P 500 E-mini futures whipsawed between the 4090s and the 4110s after the employment report was released, an hour before the opening bell. The price stayed well above yesterday’s session low, 4067.25

What does it mean? The upward correction continues. It began on October 13, 2022 and is now nearing its end. It will be followed by a final downtrend that will wrap up the larger downtrend that began on January 4, 2022, one of a series of nested downtrending waves of increasing size.

What are the alternatives? There is one.

  • The upward correction is forming a compound structure, linking two or three corrective patterns together.
  • The present “last leg” of the correction, under the principal analysis, won’t be the end of the analysis under this alternative but only the end of the first corrective pattern.
  • The first pattern will be followed by a declining connector wave and then a second corrective pattern.

[S&P 500 E-mini futures at 3:30 p.m., 105-minute bars, with volume]

What does Elliott wave theory say? Here are the waves that underly the principal analysis.

Principal analysis:

  • An upward correction, wave 4{-6}, began on October 13, 2022 and is underway.
  • The correction’s first subwave, wave A{-7}, had five subwaves, meaning the correction is taking the form of a Zigzag
  • Wave 4{-6} is in its final subwave wave, C{-7}, which began on March 13, 2023.
  • Wave C{-7} is in its final subwave, wave E{-8}.
  • Wave E{-8} is in its second subwave, declining wave B{-9}.
  • Wave E{-8} will have five subwaves altogether once it is complete.
  • As a 4th wave, wave 4{-6} has no upper limits under Elliott wave theory.
  • Wave 4{-6} will be followed by downtrending wave 5{-6}, which, like all 5th waves, might match one of a number of different patterns, all based on the downtrend’s relation with the end of the preceding 3rd wave, at 3502.
  • Usually, a 5th wave will move past the preceding 3rd wave’s end point.
  • Some 5th waves are truncated, and on this chart that means wave 5{-6} would end before reaching 3502.
  • Some 5th waves are extended, that would mean wave 5{-6} would have nine waves internally rather than the usual five, and would cover a greater than expected distance over a greater than expected period of time.

Alternative analysis:

  • Wave C{-7} may have ended on May 1 but that is not the end of the wave 4{-6} correction.
  • Wave 4{-6} is forming a compound structure and wave C{-7} ends the first corrective pattern.
  • Wave C{-7} will be followed by a declining connector, wave X{-7}, and then by a second corrective pattern.

Bigger structures:

  • This is all happening within downtrending wave 1{-5}, which began on January 4, 2022 from 4808.25.
  • Wave 1{-5} is a subwave of a nested series of larger subwaves, from wave 1{-4} to wave 1{-2}. which also began on January 4, 2022.
  • Wave 1{-2} is a subwave of wave 4{-1}, the next-to-the-last wave within a large expanding Diagonal Triangle, wave 5{0}, that began on December 26, 2018.
  • When wave 4{-1} is complete, wave 5{-1} will begin and will carry the wave above the January 4 high.25, and back to the upper boundary of the triangle, which gets higher continually and is in the 6140s.

We Are Here.

These are the waves currently in progress under my principal analysis. Each line on the list shows the wave number, with the subscript in curly brackets, the traditional degree name, the starting date, the starting price of the S&P 500 E-mini futures, and the direction of the wave.

  • S&P 500 Index:
  • 5{+3} Supercycle, 7/8/1932, 4.40 (up)
  • 5{+2} Cycle, 12/9/1974, 60.96 (up)
  • 5{+1} Primary, 3/6/2009, 666.79 (up)
  • 5{0} Intermediate, 12/26/2018, 2346.58 (up)
  • S&P 500 Futures and index:
  • 4{-1} Minor, 1/4/2022, 4808.25 (down) (futures), 4818.62 (down) (index)
  • S&P 500 Futures:
  • 1{-2} Minute, 1/4/2022, 4808.25 (down)
  • 1{-3} Minuette, 1/4/2022, 4808.25 (down)
  • 1{-4} Subminuette, 1/4/2022, 4808.25 (down)
  • 1{-5} Micro, 1/4/2022, 4808.25 (down)
  • 4{-6} Submicro, 10/13/2022, 3502 (up)
  • C{-7} Minuscule, 3/13/2023, 3830.25 (up)

Reading the chart. Elliott wave analysis views the chart as a complex structure of smaller waves nested within larger waves, which in turn are nested within still larger waves. My labeling system assigns numbers to the subwaves of trending waves, and letters to the subwaves of corrections. Each number or letter is followed by a subscript, in curly brackets, showing the waves position within the complex structure, called its “degree” in Elliott wave parlance. The smaller the number, the lower the degree. On this chart we’re dealing with relatively small waves, so the degree numbers are negative.

Learning and other resources. Elliott wave analysis provides context, not prophecy. As the 20th century semanticist Alfred Korzybski put it in his book Science and Sanity (1933), “The map is not the territory … The only usefulness of a map depends on similarity of structure between the empirical world and the map.” And I would add, in the ever-changing markets, we can judge that similarity of structure only after the fact.

See the menu page Analytical Methods for a rundown on where to go for information on Elliott wave analysis.

By Tim Bovee, Portland, Oregon, May 5, 2023

Disclaimer

Tim Bovee, Private Trader tracks the analysis and trades of a private trader for his own accounts. Nothing in this blog constitutes a recommendation to buy or sell stocks, options or any other financial instrument. The only purpose of this blog is to provide education and entertainment.

No trader is ever 100 percent successful in his or her trades. Trading in the stock and option markets is risky and uncertain. Each trader must make trading decisions for his or her own account, and take responsibility for the consequences.

License
Creative Commons License

All content on Tim Bovee, Private Trader by Timothy K. Bovee is licensed under a Creative Commons Attribution-ShareAlike 4.0 International License.

Based on a work at www.timbovee.com.

Trader’s Notebook

3:30 p.m. New York time

Half an hour before the closing bell. The S&P 500 futures have fallen during the session, to a low, so far, of 4062.25. The upward correction that began on October 13, 2022, wave 2{-6}, continues, is in its final leg, wave C{-7}, which is in its final leg, wave E{-8}, which is in its second wave, B{-9}, out of what will be a total of five subwaves.

No change from this morning’s analysis. I’ve updated the chart.

9:35 a.m. New York time

What’s happening now? The S&P 500 E-mini futures fell overnight, reaching into the 4080s so far.

What does it mean? The upward correction that began on October 13, 2023 is still underway. It is in its last leg, which in turn in its final subwave. And that rising final subwave is declining in the 2nd of five waves.

What are the alternatives? I’ve removed yesterday’s 1st alternative, which was based on the idea that the upward correction had ended at the May 1 high, 4206.25. A close-up look shows clearly that the final leg of the correction has completed one subwave and is in its 2nd subwave. The correction is forming a Zigzag pattern, with five subwaves in its 1st leg, three in its 2nd, and five in present final leg. So after that 2nd subwave is complete, there will be three more waves to go: Up, down, up.

That leaves …

Alternative #1:

  • The upward correction is forming a compound structure, linking two or three corrective patterns together.
  • The present “last leg” of the correction, under the principal analysis, won’t be the end of the analysis under this alternative but only the end of the first corrective pattern.
  • The first pattern will be followed by a declining connector wave and then a second corrective pattern.

Reading the chart. I’ve moved the chart closer in to better understand the subwaves within the final leg of the upward correction. Elliott wave analysis views the chart as a complex structure of smaller waves nested within larger waves, which in turn are nested within still larger waves, and this close-up view certainly shows that, focusing on three degrees of waves within a larger 4th degree.

My labeling system assigns numbers to the subwaves of trending waves, and letters to the subwaves of corrections. Each number or letter is followed by a subscript, in curly brackets, showing the waves position within the complex structure, called its “degree” in Elliott wave parlance. The smaller the number, the lower the degree. On this chart we’re dealing with relatively small waves, so the degree numbers are negative.

[S&P 500 E-mini futures at 3:30 p.m., 105-minute bars, with volume]

What does Elliott wave theory say? Here are the waves that underly the revised analysis.

Principal analysis:

  • An upward correction, wave 4{-6}, began on October 13, 2022 and is underway.
  • The correction’s first subwave, wave A{-7}, had five subwaves, meaning the correction is taking the form of a Zigzag
  • Wave 4{-6} is in its final subwave wave, C{-7}, which began on March 13, 2023.
  • Wave C{-7} is in its final subwave, wave E{-8}.
  • Wave E{-8} is in its second subwave, declining wave B{-9}.
  • Wave E{-8} will have five subwaves altogether once it is complete.
  • As a 4th wave, wave 4{-6} has no upper limits under Elliott wave theory.
  • Wave 4{-6} will be followed by downtrending wave 5{-6}, which, like all 5th waves, might match one of a number of different patterns, all based on the downtrend’s relation with the end of the preceding 3rd wave, at 3502.
  • Usually, a 5th wave will move past the preceding 3rd wave’s end point.
  • Some 5th waves are truncated, and on this chart that means wave 5{-6} would end before reaching 3502.
  • Some 5th waves are extended, that would mean wave 5{-6} would have nine waves internally rather than the usual five, and would cover a greater than expected distance over a greater than expected period of time.

Alternative #1:

  • Wave C{-7} may have ended on May 1 but that is not the end of the wave 4{-6} correction.
  • Wave 4{-6} is forming a compound structure and wave C{-7} ends the first corrective pattern.
  • Wave C{-7} will be followed by a declining connector, wave X{-7}, and then by a second corrective pattern.

Bigger structures:

  • This is all happening within downtrending wave 1{-5}, which began on January 4, 2022 from 4808.25.
  • Wave 1{-5} is a subwave of a nested series of larger subwaves, from wave 1{-4} to wave 1{-2}. which also began on January 4, 2022.
  • Wave 1{-2} is a subwave of wave 4{-1}, the next-to-the-last wave within a large expanding Diagonal Triangle, wave 5{0}, that began on December 26, 2018.
  • When wave 4{-1} is complete, wave 5{-1} will begin and will carry the wave above the January 4 high.25, and back to the upper boundary of the triangle, which gets higher continually and is in the 6140s.

We Are Here.

These are the waves currently in progress under my principal analysis. Each line on the list shows the wave number, with the subscript in curly brackets, the traditional degree name, the starting date, the starting price of the S&P 500 E-mini futures, and the direction of the wave.

  • S&P 500 Index:
  • 5{+3} Supercycle, 7/8/1932, 4.40 (up)
  • 5{+2} Cycle, 12/9/1974, 60.96 (up)
  • 5{+1} Primary, 3/6/2009, 666.79 (up)
  • 5{0} Intermediate, 12/26/2018, 2346.58 (up)
  • S&P 500 Futures and index:
  • 4{-1} Minor, 1/4/2022, 4808.25 (down) (futures), 4818.62 (down) (index)
  • S&P 500 Futures:
  • 1{-2} Minute, 1/4/2022, 4808.25 (down)
  • 1{-3} Minuette, 1/4/2022, 4808.25 (down)
  • 1{-4} Subminuette, 1/4/2022, 4808.25 (down)
  • 1{-5} Micro, 1/4/2022, 4808.25 (down)
  • 4{-6} Submicro, 10/13/2022, 3502 (up)
  • C{-7} Minuscule, 3/13/2023, 3830.25 (up)

Learning and other resources. Elliott wave analysis provides context, not prophecy. As the 20th century semanticist Alfred Korzybski put it in his book Science and Sanity (1933), “The map is not the territory … The only usefulness of a map depends on similarity of structure between the empirical world and the map.” And I would add, in the ever-changing markets, we can judge that similarity of structure only after the fact.

See the menu page Analytical Methods for a rundown on where to go for information on Elliott wave analysis.

By Tim Bovee, Portland, Oregon, May 4, 2023

Disclaimer

Tim Bovee, Private Trader tracks the analysis and trades of a private trader for his own accounts. Nothing in this blog constitutes a recommendation to buy or sell stocks, options or any other financial instrument. The only purpose of this blog is to provide education and entertainment.

No trader is ever 100 percent successful in his or her trades. Trading in the stock and option markets is risky and uncertain. Each trader must make trading decisions for his or her own account, and take responsibility for the consequences.

License
Creative Commons License

All content on Tim Bovee, Private Trader by Timothy K. Bovee is licensed under a Creative Commons Attribution-ShareAlike 4.0 International License.

Based on a work at www.timbovee.com.

Trader’s Notebook

3:30 p.m. New York time

Half an hour before the closing bell. The S&P 500 futures fluctuated rapidly between the 4160s and the 4110s after the Federal Open Market Committee raised the Fed Funds rate by 25 basis points to a range of 5% to 5.25%. For that hour plus a bit, the chart was filled with storm and fury, on a smallish scale, signifying nothing (to paraphrase my favorite quote from William Shakespeare).

No change from this morning’s analysis. The upward correction, wave 4{-6}, continues. I’ve updated the chart.

9:35 a.m. New York time

What’s happening now? The S&P 500 E-mini futures trended sideways overnight with a slight upward tilt, remaining in the 4130s and the 4140s.

What does it mean? The upward correction that began on October 13, 2022 continues and is in its final leg, which in turn is in its 5th and final subwave.

What are the alternatives? There are two, unchanged from yesterday.

Alternatie #1:

  • The upward correction ended at 4206.25, the high set before the May 1 opening bell.
  • The 5th wave decline has begun.

Alternative #2:

  • The upward correction is forming a compound structure, linking two or three corrective patterns together.
  • The present “last leg” of the correction, under the principal analysis, won’t be the end of the analysis under this alternative but only the end of the first corrective pattern.
  • The first pattern will be followed by a declining connector wave and then a second corrective pattern.

Reading the chart. I’ve retained the Fibonacci ladder on the chart, in red, showing significant potential reversal points in the upward correction’s retracement of the downtrend that preceded it.

Elliott wave analysis views the chart as a complex structure of smaller waves nested within larger waves, which in turn are nested within still larger waves. My labeling system assigns numbers to the subwaves of trending waves, and letters to the subwaves of corrections. Each number or letter is followed by a subscript, in curly brackets, showing the waves position within the complex structure, called its “degree” in Elliott wave parlance. The smaller the number, the lower the degree. On this chart we’re dealing with relatively small waves, so the degree numbers are negative.

[S&P 500 E-mini futures at 9:35 a.m., 8-hour bars, with volume]

What does Elliott wave theory say?

Here are the waves that underly the revised analysis.

Principal analysis:

  • An upward correction, wave 4{-6}, began on October 13, 2022 and is underway.
  • Wave 4{-6} is in its final subwave wave, C{-7}, which began on March 13, 2023.
  • Wave C{-7} is in its final subwave, wave E{-8}.
  • As a 4th wave, wave 4{-6} has no upper limits under Elliott wave theory.
  • Wave 4{-6} will be followed by downtrending wave 5{-6}, which, like all 5th waves, might match one of a number of different patterns, all based on the downtrend’s relation with the end of the preceding 3rd wave, at 3502.
  • Usually, a 5th wave will move past the preceding 3rd wave’s end point.
  • Some 5th waves are truncated, and on this chart that means wave 5{-6} would end before reaching 3502.
  • Some 5th waves are extended, that would mean wave 5{-6} would have nine waves internally rather than the usual five, and would cover a greater than expected distance over a greater than expected period of time.

Alternative #1:

  • Wave 4{-6} ended on May 1 at 4206.25.
  • Wave 5{-6} is underway.

Alternative #2:

  • Wave C{-7} may have ended on May 1 but that is not the end of the wave 4{-6} correction.
  • Wave 4{-6} is forming a compound structure and wave C{-7} ends the first corrective pattern.
  • Wave C{-7} will be followed by a declining connector, wave X{-7}, and then by a second corrective pattern.

Bigger structures:

  • This is all happening within downtrending wave 1{-5}, which began on January 4, 2022 from 4808.25.
  • Wave 1{-5} is a subwave of a nested series of larger subwaves, from wave 1{-4} to wave 1{-2}. which also began on January 4, 2022.
  • Wave 1{-2} is a subwave of wave 4{-1}, the next-to-the-last wave within a large expanding Diagonal Triangle, wave 5{0}, that began on December 26, 2018.
  • When wave 4{-1} is complete, wave 5{-1} will begin and will carry the wave above the January 4 high.25, and back to the upper boundary of the triangle, which gets higher continually and is in the 6140s.

We Are Here.

These are the waves currently in progress under my principal analysis. Each line on the list shows the wave number, with the subscript in curly brackets, the traditional degree name, the starting date, the starting price of the S&P 500 E-mini futures, and the direction of the wave.

  • S&P 500 Index:
  • 5{+3} Supercycle, 7/8/1932, 4.40 (up)
  • 5{+2} Cycle, 12/9/1974, 60.96 (up)
  • 5{+1} Primary, 3/6/2009, 666.79 (up)
  • 5{0} Intermediate, 12/26/2018, 2346.58 (up)
  • S&P 500 Futures and index:
  • 4{-1} Minor, 1/4/2022, 4808.25 (down) (futures), 4818.62 (down) (index)
  • S&P 500 Futures:
  • 1{-2} Minute, 1/4/2022, 4808.25 (down)
  • 1{-3} Minuette, 1/4/2022, 4808.25 (down)
  • 1{-4} Subminuette, 1/4/2022, 4808.25 (down)
  • 1{-5} Micro, 1/4/2022, 4808.25 (down)
  • 4{-6} Submicro, 10/13/2022, 3502 (up)
  • C{-7} Minuscule, 3/13/2023, 3830.25 (up)

Learning and other resources. Elliott wave analysis provides context, not prophecy. As the 20th century semanticist Alfred Korzybski put it in his book Science and Sanity (1933), “The map is not the territory … The only usefulness of a map depends on similarity of structure between the empirical world and the map.” And I would add, in the ever-changing markets, we can judge that similarity of structure only after the fact.

See the menu page Analytical Methods for a rundown on where to go for information on Elliott wave analysis.

By Tim Bovee, Portland, Oregon, May 3, 2023

Disclaimer

Tim Bovee, Private Trader tracks the analysis and trades of a private trader for his own accounts. Nothing in this blog constitutes a recommendation to buy or sell stocks, options or any other financial instrument. The only purpose of this blog is to provide education and entertainment.

No trader is ever 100 percent successful in his or her trades. Trading in the stock and option markets is risky and uncertain. Each trader must make trading decisions for his or her own account, and take responsibility for the consequences.

License
Creative Commons License

All content on Tim Bovee, Private Trader by Timothy K. Bovee is licensed under a Creative Commons Attribution-ShareAlike 4.0 International License.

Based on a work at www.timbovee.com.

Trader’s Notebook

3:30 p.m. New York time

Half an hour before the closing bell. The S&P 500 futures have fallen during the session, reaching a low so far of 4105.50. The lower the price goes, the more likely it becomes that the upward correction that began on October 13, 2022, wave 2{-6}, ended at the May 1 high, 4206.25. That scenario, however, is not yet a certainty, and for now I shall continue to mark the chat showing wave 2{-6} as still being underway. I’ve updated the chart.

9:35 a.m. New York time

What’s happening now? The S&P 500 E-mini futures fell overnight, reaching into the 4160s at the opening bell.

What does it mean? The upward correction that began on October 13 last year continues and is in its final leg, which in turn is in its final subwave. The correction, a 4th wave, has retraced beyond the 78.6% Fibonacci level and is in a position where it could end at any time, although there’s no requirement that it end quickly. Indeed, it could linger for quite some time under the rules of Elliott wave analysis, since a 4th wave, unlike a 2nd wave, has no boundary limiting how far it can proceed.

I’ve superimposed a Fibonacci retracement ladder on the chart, in red, to make it easier to track the progress of the correction’s last leg.

The upward correction will be followed by a 5th wave decline that I expect to bring the price back into the low 3500s at the least, and possibly significantly lower.

What are the alternatives? There are two.

Alternatie #1:

  • The upward correction ended at 4206.25, the high set before yesterday’s opening bell.
  • The 5th wave decline has begun.

Alternative #2:

  • The upward correction is forming a compound structure, linking two or three corrective patterns together.
  • The present “last leg” of the correction, under the principal analysis, won’t be the end of the analysis under this alternative but only the end of the first corrective pattern.
  • The first pattern will be followed by a declining connector wave and then a second corrective pattern.

[S&P 500 E-mini futures at 9:35 a.m., 8-hour bars, with volume]

What does Elliott wave theory say? Here are the waves that underly the revised analysis.

Principal analysis:

  • An upward correction, wave 4{-6}, began on October 13, 2022 and is underway.
  • Wave 4{-6} is in its final subwave wave, C{-7}, which began on March 13, 2023.
  • Wave C{-7} is in its final subwave, wave E{-8}.
  • As a 4th wave, wave 4{-6} has no upper limits under Elliott wave theory.
  • Wave 4{-6} will be followed by downtrending wave 5{-6}, which, like all 5th waves, might match one of a number of different patterns, all based on the downtrend’s relation with the end of the preceding 3rd wave, at 3502.
  • Usually, a 5th wave will move past the preceding 3rd wave’s end point.
  • Some 5th waves are truncated, and on this chart that means wave 5{-6} would end before reaching 3502.
  • Some 5th waves are extended, that would mean wave 5{-6} would have nine waves internally rather than the usual five, and would cover a greater than expected distance over a greater than expected period of time.

Alternative #1:

  • Wave 4{-6} ended on May 1 at 4206.25.
  • Wave 5{-6} is underway.

Alternative #2:

  • Wave C{-7} may have ended on May 1 but that is not the end of the wave 4{-6} correction.
  • Wave 4{-6} is forming a compound structure and wave C{-7} ends the first corrective pattern.
  • Wave C{-7} will be followed by a declining connector, wave X{-7}, and then by a second corrective pattern.

Bigger structures:

  • This is all happening within downtrending wave 1{-5}, which began on January 4, 2022 from 4808.25.
  • Wave 1{-5} is a subwave of a nested series of larger subwaves, from wave 1{-4} to wave 1{-2}. which also began on January 4, 2022.
  • Wave 1{-2} is a subwave of wave 4{-1}, the next-to-the-last wave within a large expanding Diagonal Triangle, wave 5{0}, that began on December 26, 2018.
  • When wave 4{-1} is complete, wave 5{-1} will begin and will carry the wave above the January 4 high.25, and back to the upper boundary of the triangle, which gets higher continually and is in the 6140s.

We Are Here.

These are the waves currently in progress under my principal analysis. Each line on the list shows the wave number, with the subscript in curly brackets, the traditional degree name, the starting date, the starting price of the S&P 500 E-mini futures, and the direction of the wave.

  • S&P 500 Index:
  • 5{+3} Supercycle, 7/8/1932, 4.40 (up)
  • 5{+2} Cycle, 12/9/1974, 60.96 (up)
  • 5{+1} Primary, 3/6/2009, 666.79 (up)
  • 5{0} Intermediate, 12/26/2018, 2346.58 (up)
  • S&P 500 Futures and index:
  • 4{-1} Minor, 1/4/2022, 4808.25 (down) (futures), 4818.62 (down) (index)
  • S&P 500 Futures:
  • 1{-2} Minute, 1/4/2022, 4808.25 (down)
  • 1{-3} Minuette, 1/4/2022, 4808.25 (down)
  • 1{-4} Subminuette, 1/4/2022, 4808.25 (down)
  • 1{-5} Micro, 1/4/2022, 4808.25 (down)
  • 4{-6} Submicro, 10/13/2022, 3502 (up)
  • C{-7} Minuscule, 3/13/2023, 3830.25 (up)

Reading the chart. Elliott wave analysis views the chart as a complex structure of smaller waves nested within larger waves, which in turn are nested within still larger waves. My labeling system assigns numbers to the subwaves of trending waves, and letters to the subwaves of corrections. Each number or letter is followed by a subscript, in curly brackets, showing the waves position within the complex structure, called its “degree” in Elliott wave parlance. The smaller the number, the lower the degree. On this chart we’re dealing with relatively small waves, so the degree numbers are negative.

Learning and other resources. Elliott wave analysis provides context, not prophecy. As the 20th century semanticist Alfred Korzybski put it in his book Science and Sanity (1933), “The map is not the territory … The only usefulness of a map depends on similarity of structure between the empirical world and the map.” And I would add, in the ever-changing markets, we can judge that similarity of structure only after the fact.

See the menu page Analytical Methods for a rundown on where to go for information on Elliott wave analysis.

By Tim Bovee, Portland, Oregon, May 2, 2023

Disclaimer

Tim Bovee, Private Trader tracks the analysis and trades of a private trader for his own accounts. Nothing in this blog constitutes a recommendation to buy or sell stocks, options or any other financial instrument. The only purpose of this blog is to provide education and entertainment.

No trader is ever 100 percent successful in his or her trades. Trading in the stock and option markets is risky and uncertain. Each trader must make trading decisions for his or her own account, and take responsibility for the consequences.

License
Creative Commons License

All content on Tim Bovee, Private Trader by Timothy K. Bovee is licensed under a Creative Commons Attribution-ShareAlike 4.0 International License.

Based on a work at www.timbovee.com.

Trader’s Notebook

3:30 p.m. New York time

Half an hour before the closing bell. The S&P 500 futures peaked at 4206.25 and index, at 4196.92. Both then fell, the futures into the 4180s and the index into the 4160s. The upward correction that began on October 13, 2022 continues and is in its 3rd leg, wave C{-7}.

I don’t yet have a clear count of the subwaves within wave C{-7}. What is clear is the length taken by the two preceding legs of the correction. Wave A{-7} took about two months to complete it’s run. Wave B{-7} took three months. And wave C{-7} has been in progress for a month and a half. So by that metric, wave C{-8} problem has more room to rise before reaching its end.

Bottom line: The revised analysis is far more friendly to the bull side than was the prior analysis. I’ll get into target-setting later in the week. And yet, despite the bullish look, the chart contains a warning: There’s no firm rule that requires a wave to be proportional to the waves that came before it within a pattern. They can end more quickly, or last longer.

I’ve updated the upper chart, which shows this morning’s revised analysis.

10:40 a.m. New York time

The Revised Analysis. Here is the revised analysis of the S&P 500 E-Mini futures. In order to describe it, I’ll need to use Elliott wave terminology extensively. For a rundown on how it works, see the “Reading the chart” section below.

The changes begin with the beginning of wave 3{-6}, a subwave of wave 1{-5}, which began on January 4, 2022 from 4808.25.

Under the new scenario: The S&P 500 has been in an upward correction since October 13, 2022 — wave 4{-6} — and is presently in the final subwave of that correction. Wave 5{-6} will follow and is likely to carry the price below 3502, the correction’s starting point, and perhaps significantly below that level. Fifth waves have variety. They can truncate and remain above the starting point of the preceding correction, or they can extend, adding subwaves that will carry the 5th wave a large distance across a large span of time.

The present upward correction had five subwaves within its first wave, A{-8}, and so is taking the form of a Zigzag. The second wave, B{-8}, ended on March 13 and wave C{-8}, the final wave, is in progress.

Here is a chart showing wave 3{-6} so far.

[Revised analysis: S&P 500 E-mini futures at 3:30 p.m., 8-hour bars, with volume]

9:35 a.m. New York time

What’s happening now? The S&P 500 E-mini futures rose after trading resumed overnight, reaching a high so far of 4196 and then declining back into the 4180s. The S&P 500 index broke a rule of Elliott wave analysis by breaking above 4169.48 and the present analysis will be redone. That takes time, and for now, I’m retaining the futures analysis as it was before the breakout.

What does it mean? The rise brought the price to within 2.25 points of the start of the decline that began on April 18, a downtrend that preceded the present upward correction, which began on April 26. The S&P 500 index broke above its upper limit as the opening bell approached. I’ve marked the chart as though the present upward correction were still underway.

A break-out above that downtrend’s starting point, 4198.25 on the futures would go against a rule of Elliott wave analysis. The rule was broken just minutes ago on the index chart. The rule goes like this: The downtrend is a 1st wave, the present correction is a 2nd wave. No 2nd wave, under the rules, can break above the starting point of the starting point that came before it. If it does, then the analysis no longer matches the chart.

To pull the quote from the 20th century semanticist Alfred Korzybski that leads the “Learning and Other Resources” section of every Trader’s Notebook: “The map is not the territory … The only usefulness of a map depends on similarity of structure between the empirical world and the map.” So it is with Elliott wave analysis and the stock market charts that are it’s bread and butter.

Naturally, since the E-mini futures are one of many derivatives of the S&P 500 index, nothing is that simple. See my discussion, below, titled “Breaking out is hard to do”.

What are the alternatives? It’s possible that the price will retreat on both the index and the futures, marking the end of the upward correction and the beginning of a 3rd-wave downtrend.

[Outdated by an analysis revisions: S&P 500 E-mini futures at 9:35 a.m., 25-minute bars, with volume]

Breaking out is hard to do. In theory, the S&P 500 index and its derivatives, such as the S&P 500 futures, all march to the beat of the same drummer: Different products, same analysis. In practice, there are differences.

The S&P 500 futures move in 25-cent increments. The S&P 500 index moves in 1-cent increments. So it’s quite possible for the futures to break out above a level while the index remains below.

Moreover, the futures trade 24-hours a day, from Sunday evening New York time to Friday evening at the market session close. The index is calculated only during the market sessions. So if the futures break out overnight and then retreat below the breakout level before the session begins, then the index shows no sign of a breakout.

So what’s an Elliott wave analyst to do? Decades ago, I posted the question to an analyst at the world’s leading Elliott wave analysis company, Elliott Wave International. He replied that the index and the futures should be treated separately. A breakout by the futures has no impact when analyzing the index, and vice versa.

Over the years, I’ve become increasingly wary of that answer. The futures are a way of trading the index. End of story. And if the futures don’t reflect the index and the index, the futures, then what’s the point?

So I’ve reached a place where I treat the index as being authoritative in confirming a breakout. If the futures break out and the index doesn’t, then I don’t treat the futures as having actually broken out until the index breaks out. If the index stays below the break-out point, then the futures breakout never occurred. If the index eventually moves above its own breakout point, then the futures breakout is confirmed, even if it has subsequently retreated below the break-out point.

And on the present charts, the index has broken out, today, before the opening bell. The futures have not. Since the index decides, I’ve marked the futures chart as though the upward correction was still underway.

As noted above, the futures breakout point is 4198.25. For the index, the corresponding breakout point is 4169.96, a level reached shortly after the opening bell today.

What does Elliott wave theory say? Here are the waves that underly the revised analysis.

Principal analysis:

  • An upward correction, wave 4{-6}, began on October 13, 2022 and underway.
  • Wave 4{-6} is in its final subwave wave, C{-7}, which began on March 13, 2023.
  • As a 4th wave, wave 4{-6} has no upper limits under Elliott wave theory.
  • Wave 4{-6} will be followed by downtrending wave 5{-6}, which, like all 5th waves, might match one of a number of different patterns, all based on the downtrend’s relation with the end of the preceding 3rd wave, at 3502.
  • Usually, a 5th wave will move past the preceding 3rd wave’s end point.
  • Some 5th waves are truncated, and on this chart that means wave 5{-6} would end before reaching 3502.
  • Some 5th waves are extended, that would mean wave 5{-6} would have nine waves internally rather than the usual five, and would cover a greater than expected distance over a greater than expected period of time.

Bigger structures:

  • This is all happening within downtrending wave 1{-5}, which began on January 4, 2022 from 4808.25.
  • Wave 1{-5} is a subwave of a nested series of larger subwaves, from wave 1{-4} to wave 1{-2}. which also began on January 4, 2022.
  • Wave 1{-2} is a subwave of wave 4{-1}, the next-to-the-last wave within a large expanding Diagonal Triangle, wave 5{0}, that began on December 26, 2018.
  • When wave 4{-1} is complete, wave 5{-1} will begin and will carry the wave above the January 4 high.25, and back to the upper boundary of the triangle, which gets higher continually and is in the 6140s.

Reading the chart. Elliott wave analysis views the chart as a complex structure of smaller waves nested within larger waves, which in turn are nested within still larger waves. My labeling system assigns numbers to the subwaves of trending waves, and letters to the subwaves of corrections. Each number or letter is followed by a subscript, in curly brackets, showing the waves position within the complex structure, called its “degree” in Elliott wave parlance. The smaller the number, the lower the degree. On this chart we’re dealing with relatively small waves, so the degree numbers are negative.

We Are Here. These are the waves currently in progress under my principal analysis. Each line on the list shows the wave number, with the subscript in curly brackets, the traditional degree name, the starting date, the starting price of the S&P 500 E-mini futures, and the direction of the wave.

  • S&P 500 Index:
  • 5{+3} Supercycle, 7/8/1932, 4.40 (up)
  • 5{+2} Cycle, 12/9/1974, 60.96 (up)
  • 5{+1} Primary, 3/6/2009, 666.79 (up)
  • 5{0} Intermediate, 12/26/2018, 2346.58 (up)
  • S&P 500 Futures and index:
  • 4{-1} Minor, 1/4/2022, 4808.25 (down) (futures), 4818.62 (down) (index)
  • S&P 500 Futures:
  • 1{-2} Minute, 1/4/2022, 4808.25 (down)
  • 1{-3} Minuette, 1/4/2022, 4808.25 (down)
  • 1{-4} Subminuette, 1/4/2022, 4808.25 (down)
  • 1{-5} Micro, 1/4/2022, 4808.25 (down)
  • 4{-6} Submicro, 10/13/2022, 3502 (up)
  • C{-7} Minuscule, 3/13/2023, 3830.25 (up)

Learning and other resources. Elliott wave analysis provides context, not prophecy. As the 20th century semanticist Alfred Korzybski put it in his book Science and Sanity (1933), “The map is not the territory … The only usefulness of a map depends on similarity of structure between the empirical world and the map.” And I would add, in the ever-changing markets, we can judge that similarity of structure only after the fact.

See the menu page Analytical Methods for a rundown on where to go for information on Elliott wave analysis.

By Tim Bovee, Portland, Oregon, May 1, 2023

Disclaimer

Tim Bovee, Private Trader tracks the analysis and trades of a private trader for his own accounts. Nothing in this blog constitutes a recommendation to buy or sell stocks, options or any other financial instrument. The only purpose of this blog is to provide education and entertainment.

No trader is ever 100 percent successful in his or her trades. Trading in the stock and option markets is risky and uncertain. Each trader must make trading decisions for his or her own account, and take responsibility for the consequences.

License
Creative Commons License

All content on Tim Bovee, Private Trader by Timothy K. Bovee is licensed under a Creative Commons Attribution-ShareAlike 4.0 International License.

Based on a work at www.timbovee.com.

Trader’s Notebook

3:30 p.m. New York time

Half an hour before the closing bell. The S&P 500 futures rose during the session to 4186.25 (so far). The decline from yesterday’s peak, discussed in this morning’s post, turned out to be too shallow to count as the second leg of the upward correction, based on the rule of proportionality. So I’m modifying this morning’s analysis to this very tentative analysis: The principal analysis is that first subwave of the correction, wave A{-10}, is still underway. The alternative is that it may have ended at the session high. There are reasons to distrust the alternative scenario, and also reasons to distrust the principal scenario.

It’s at times like these that Elliott wave analysis becomes fun. So let’s parse the possibilities.

I distrust the scenario that says wave A{-10} hasn’t yet ended because, under the rules of Elliott wave analysis, there just isn’t that much upside left. The correction, wave 2{-9}, can’t move above the start of the preceding 1st wave, which was 4198.25. If it does, then it has broken a rule and the analysis will have to be changed. The session high is only 12 points below that limit.

I distrust the alternative scenario that says wave A{-10} ended at today’s peak and wave B{-10} is underway. Today’s larger movements have altered proportionality for the wave to a larger standard. If A{-10} has ended, it had only three internal waves, making the correction a Flat. The tendency for 2nd waves is that they have five subwaves in the A wave, making them Zigzags. The Zigzag tendency isn’t a rule, so it’s possible that wave B{-10} is underway. Nonetheless, the appearance of a Flat 2nd wave is a reason for enhanced caution in the analysis.

For now, I’m marking the chart to show wave A{-10} is still underway, but with low confidence in that analysis.

I’ve retained this morning’s chart for comparison and have added a new chart with this afternoon’s analysis.

[S&P 500 E-mini futures at 3:30 p.m., 25-minute bars, with volume]

9:35 a.m. New York time

What’s happening now? The S&P 500 E-mini futures peaked shortly after yesterday’s closing bell at 4166.50 and then fell into the 4130s.

What does it mean? The first leg of the upward correction that began on April 26 ended at yesterday’s peak, and the declining second leg is underway. It will be followed by rising third leg that will complete the upward correction.

The peak was 4 points below the 78.6% Fibonacci retracement level. I’ve superimposed the Fibonacci retracement ladder on the chart, in red.

The momentum of the first leg of the correction was so strong that it’s hard to see the details within the wave, but I count five subwaves, meaning that the correction is taking a Zigzag pattern. The correction is a 2nd wave, and the Zigzag pattern is usually how 2nd waves play out.

As a Zigzag, the present downtrend has a restriction under the rules of Elliott wave analysis. It cannot move below the start of the preceding first leg of the correction, which began from 4068.75.

What are the alternatives? None at present. Without a doubt, ambiguities will appear as the correction continues.

[Outdated by new analysis: See above. S&P 500 E-mini futures at 9:35 a.m., 25-minute bars, with volume]

What does Elliott wave theory say? Here are the waves that underly the analysis. [Outdated by this afternoon’s analysis. See above]

Principal analysis:

  • The upward correction that began on April 26 is wave 2{-9}.
  • It is a subwave of the downtrend that began on April 18, 3{-8}.
  • Internally, wave 2{-9} is in wave B{-10}, the middle wave of three in a correction that is taking a Zigzag pattern.
  • The first subwave in the correction, wave A{-10}, had five subwaves. Wave B{-10} will have three subwaves, and the future rising wave C{-10} that will complete the correction, five subwaves.
  • Wave B{-10}, as part of a Zigzag, will remain above 4068.75, the starting point of its subwave A{-10} and of the correction, wave 2{-9}.
  • Wave 2{-9} will be followed by the most energetic part of the downtrend, wave 3{-9}.
  • The parent downtrend, wave 3{-8}, will carry the price below the starting point, 3830.25, of wave 2{-8}, the upward correction that began on March 13 and ended on April 18. Most likely the price will decline significantly below that level.

Bigger structures:

  • This is all happening within downtrending wave 3{-7}, which began on February 2.
  • Wave 3{-7} is a subwave of downtrending wave 3{-6}, which began on August 16, 2022.
  • Wave 3{-6} is encompassed by a series of larger declining waves, the smaller within the larger, stretching up five degrees to wave 4{-1}, which began on January 4, 2022.
  • Wave 4{-1} is the next-to-the-last wave within a large expanding Diagonal Triangle, wave 5{0}, that began on December 26, 2018
  • When wave 4{-1} is complete, wave 5{-1} will begin and will carry the wave above the January 4 high, 4808.25, and back to the upper boundary of the triangle, which gets higher continually and is in the 6090s.

Reading the chart. Elliott wave analysis views the chart as a complex structure of smaller waves nested within larger waves, which in turn are nested within still larger waves. My labeling system assigns numbers to the subwaves of trending waves, and letters to the subwaves of corrections. Each number or letter is followed by a subscript, in curly brackets, showing the waves position within the complex structure, called its “degree” in Elliott wave parlance. The smaller the number, the lower the degree. On this chart we’re dealing with relatively small waves, so the degree numbers are negative.

We Are Here.

These are the waves currently in progress under my principal analysis. Each line on the list shows the wave number, with the subscript in curly brackets, the traditional degree name, the starting date, the starting price of the S&P 500 E-mini futures, and the direction of the wave.

  • S&P 500 Index:
  • 5{+3} Supercycle, 7/8/1932, 4.40 (up)
  • 5{+2} Cycle, 12/9/1974, 60.96 (up)
  • 5{+1} Primary, 3/6/2009, 666.79 (up)
  • 5{0} Intermediate, 12/26/2018, 2346.58 (up)
  • S&P 500 Futures and index:
  • 4{-1} Minor, 1/4/2022, 4808.25 (down) (futures), 4818.62 (down) (index)
  • S&P 500 Futures:
  • 1{-2} Minute, 1/4/2022, 4808.25 (down)
  • 1{-3} Minuette, 1/4/2022, 4808.25 (down)
  • 1{-4} Subminuette, 1/4/2022, 4808.25 (down)
  • 1{-5} Micro, 1/4/2022, 4808.25 (down)
  • 3{-6} Submicro, 8/16/2022, 4327.50 (down)
  • 3{-7} Minuscule, 2/2/2023, 4208.50 (down)

Learning and other resources. Elliott wave analysis provides context, not prophecy. As the 20th century semanticist Alfred Korzybski put it in his book Science and Sanity (1933), “The map is not the territory … The only usefulness of a map depends on similarity of structure between the empirical world and the map.” And I would add, in the ever-changing markets, we can judge that similarity of structure only after the fact.

See the menu page Analytical Methods for a rundown on where to go for information on Elliott wave analysis.

By Tim Bovee, Portland, Oregon, April 28, 2023

Disclaimer

Tim Bovee, Private Trader tracks the analysis and trades of a private trader for his own accounts. Nothing in this blog constitutes a recommendation to buy or sell stocks, options or any other financial instrument. The only purpose of this blog is to provide education and entertainment.

No trader is ever 100 percent successful in his or her trades. Trading in the stock and option markets is risky and uncertain. Each trader must make trading decisions for his or her own account, and take responsibility for the consequences.

License
Creative Commons License

All content on Tim Bovee, Private Trader by Timothy K. Bovee is licensed under a Creative Commons Attribution-ShareAlike 4.0 International License.

Based on a work at www.timbovee.com.

Trader’s Notebook

3:30 p.m. New York time

Half an hour before the closing bell. The S&P 500 futures rose during the session into the 4150s so far, moving past the 61.8% Fibonacci retracement level. That is, the upward correction is close to taking back two-thirds of the 129.50 decline between April 18 and April 26. The 61.8% Fibonacci level is at 4148.78 on this retracement.

The present rise is the first subwave, wave A{-10}, within the upward correction, wave 2{-9}, that began on April 26. It will be followed by a downward wave B{-10}, and then a final rising wave C{-10}.

The correction will remain below 4198.25, the start of the preceding 1st wave, a firm rule of Elliott wave analysis. If the correction price goes above that level, then the analysis no longer matches the chart and will be revised.

I’ve superimposed the Fibonacci retracement ladder on the chart, in red, to better track the retracement. Upward corrections often reverse around Fibonacci retracement levels, and 61.8% is a major level, so I wouldn’t be surprised to see wave A{-10} come to an end soon. On the other hand, there are many retracements that move well beyond that level, so the length is the retracement is uncertain.

This morning’s analysis is unchanged. I’ve updated the chart.

9:35 a.m. New York time

What’s happening now? The S&P 500 E-mini futures rose overnight to 4105.75 and then fell sharply into the 4080s, the decline coinciding with the release of new Gross Domestic Product statistics. The price then rose again, almost reaching the overnight peak.

What does it mean? Yesterday’s low (April 26) marked the end of the 1st wave of the downtrend that began on April 18. The rise that followed is the first leg of a 2nd wave upward correction that will remain below 4198.25, the start of the preceding 1st wave. The correction will be followed by an energetic 3rd wave downtrend.

What are the alternatives? None at present. I’m sure some ambiguities will develop, as they always do.

Reading the chart. I adjusted the chart numbering to avoid a rule of Elliott wave analysis that forbids a 3rd wave being the shortest downward wave in a downtrend, changing the endpoint of waves 1{-10} and 2{-10} to earlier, and the end of waves 3{-10} and 4{-10} to later. The prior numbering can be seen in yesterday’s Trader’s Notebook.

Elliott wave analysis views the chart as a complex structure of smaller waves nested within larger waves, which in turn are nested within still larger waves. My labeling system assigns numbers to the subwaves of trending waves, and letters to the subwaves of corrections. Each number or letter is followed by a subscript, in curly brackets, showing the waves position within the complex structure, called its “degree” in Elliott wave parlance. The smaller the number, the lower the degree. On this chart we’re dealing with relatively small waves, so the degree numbers are negative.

[S&P 500 E-mini futures at 3:30 p.m., 20-minute bars, with volume]

What does Elliott wave theory say? Here are the waves that underly the analysis.

Principal analysis:

  • The downtrend that began on April 18 is wave 3{-8}.
  • Within it, wave 1{-9}, the first of five waves, ended on April 26 and wave 2{-9} began and is underway..
  • Wave 1{-9} internally is in its final wave, 5{-10}.
  • Wave 2{-9} will be followed by the most energetic part of the downtrend, wave 3{-9}.
  • The parent wave, downtrend 3{-8}, will carry the price below the starting point, 3830.25, of wave 2{-8}, the upward correction that began on March 13 and ended on April 18. Most likely the price will decline significantly below that level.

Revision in wave labeling:

I’ve made the following changes to wave endpoints on the chart, within wave 1{-9}.

  • Wave 1{-10} moved from 4/20 to 4/19.
  • Wave 2{-10} from 4/20 to 4/19
  • Wave 3{-10} from 4/23 to 4/25
  • Wave 4{-10} from 4/23 to 4/25

Bigger structures:

  • This is all happening within downtrending wave 3{-7}, which began on February 2.
  • Wave 3{-7} is a subwave of downtrending wave 3{-6}, which began on August 16, 2022.
  • Wave 3{-6} is encompassed by a series of larger declining waves, the smaller within the larger, stretching up five degrees to wave 4{-1}, which began on January 4, 2022.
  • Wave 4{-1} is the next-to-the-last wave within a large expanding Diagonal Triangle, wave 5{0}, that began on December 26, 2018
  • When wave 4{-1} is complete, wave 5{-1} will begin and will carry the wave above the January 4 high, 4808.25, and back to the upper boundary of the triangle, which gets higher continually and is in the 6090s.

We Are Here.

These are the waves currently in progress under my principal analysis. Each line on the list shows the wave number, with the subscript in curly brackets, the traditional degree name, the starting date, the starting price of the S&P 500 E-mini futures, and the direction of the wave.

  • S&P 500 Index:
  • 5{+3} Supercycle, 7/8/1932, 4.40 (up)
  • 5{+2} Cycle, 12/9/1974, 60.96 (up)
  • 5{+1} Primary, 3/6/2009, 666.79 (up)
  • 5{0} Intermediate, 12/26/2018, 2346.58 (up)
  • S&P 500 Futures and index:
  • 4{-1} Minor, 1/4/2022, 4808.25 (down) (futures), 4818.62 (down) (index)
  • S&P 500 Futures:
  • 1{-2} Minute, 1/4/2022, 4808.25 (down)
  • 1{-3} Minuette, 1/4/2022, 4808.25 (down)
  • 1{-4} Subminuette, 1/4/2022, 4808.25 (down)
  • 1{-5} Micro, 1/4/2022, 4808.25 (down)
  • 3{-6} Submicro, 8/16/2022, 4327.50 (down)
  • 3{-7} Minuscule, 2/2/2023, 4208.50 (down)

Learning and other resources. Elliott wave analysis provides context, not prophecy. As the 20th century semanticist Alfred Korzybski put it in his book Science and Sanity (1933), “The map is not the territory … The only usefulness of a map depends on similarity of structure between the empirical world and the map.” And I would add, in the ever-changing markets, we can judge that similarity of structure only after the fact.

See the menu page Analytical Methods for a rundown on where to go for information on Elliott wave analysis.

By Tim Bovee, Portland, Oregon, April 27, 2023

Disclaimer

Tim Bovee, Private Trader tracks the analysis and trades of a private trader for his own accounts. Nothing in this blog constitutes a recommendation to buy or sell stocks, options or any other financial instrument. The only purpose of this blog is to provide education and entertainment.

No trader is ever 100 percent successful in his or her trades. Trading in the stock and option markets is risky and uncertain. Each trader must make trading decisions for his or her own account, and take responsibility for the consequences.

License
Creative Commons License

All content on Tim Bovee, Private Trader by Timothy K. Bovee is licensed under a Creative Commons Attribution-ShareAlike 4.0 International License.

Based on a work at www.timbovee.com.